The bushing stiffness properties are approximated by a single coefficient–the
stiffness at the operating point. The force generated by the bushing
is:Figure 1.
Where,
k is the stiffness.
x is the deflection.
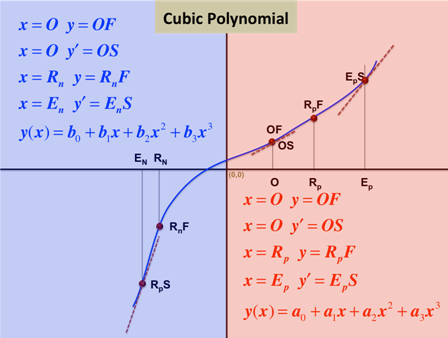
Cubic Stiffness Model
The bushing stiffness is approximated by two cubic polynomials that are derived from
the Static Force versus Deflection curve. Below, the measured static data is shown
as a blue curve:Figure 2.
The five points in the selected area of the plot above are:
Point
Description
Location on Plot
O
Operating point.
The force value, OF, and the slope of the static curve, OS,
are selected.
Ep
End point for positive deformation.
This is usually the maximum positive deformation in the
static test. At EP, the slope of the static curve,
EPS, is selected.
Rp
Reference point for positive deformation.
As a default, RP = (O + EP)/2. At
RP, the force of the static curve,
RPF, is selected.
EN
End point for negative deformation.
This is usually the maximum negative deformation in the
static test. At EN, the slope of the static curve,
ENS, is selected.
RN
Reference point for negative deformation.
As a default, RN = (O + EN)/2. At
RN, the force of the static curve,
RNF, is selected.
Spline Stiffness Model
Spline data is derived by reducing the static data to a curve. A cubic spline is
fitted through the measured static data. The spline is then used as the
interpolating function for calculating the force at any deflection.