Solver View Form
-screen option not present in the command line), the simple
text window opens to show output from the solver (Figure 2).
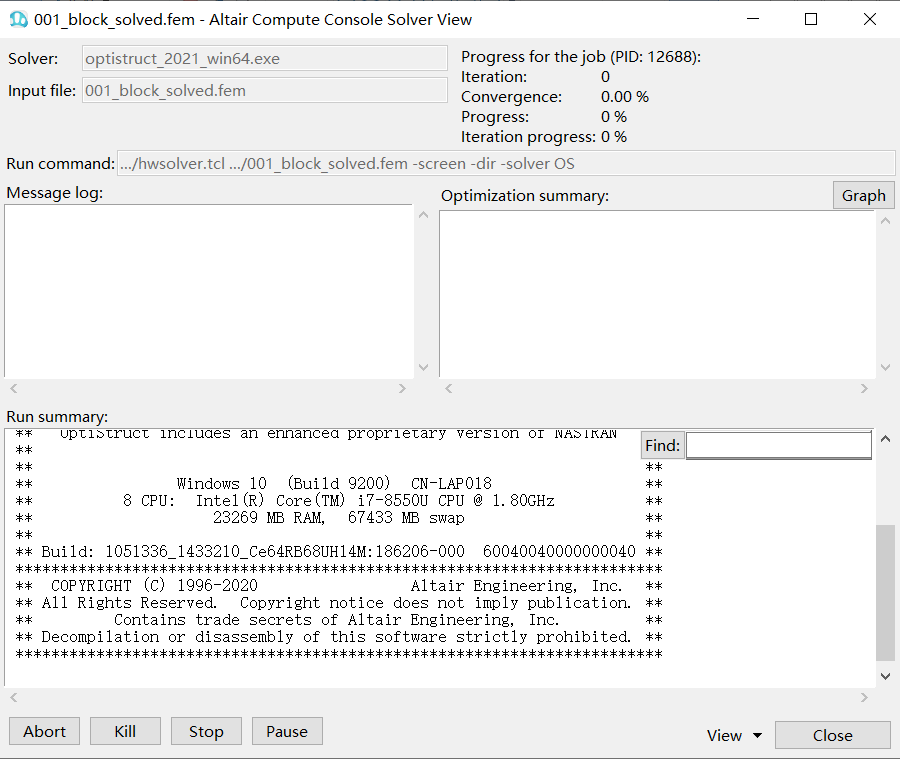
The top section of the form shows several fields containing the actual name of the Solver binary, name of the Input file, the Run command line with all options used to start the solver, and the estimated Progress of the solution.
There are two text fields in the center of the form; the Message log field shows messages from the solver (usually warnings and errors), while the Optimization summary field shows a table representing the convergence of solutions for different subcases in each optimization step. The Graph button inside the Optimization summary window allows you to open a simple X-Y plot and browse the dynamic convergence of various variables displayed in the Optimization summary window.
The Run summary field represents the standard screen output from the solver. For
OptiStruct, it is recommended to use the option
-out to increase the amount of information printed to the
screen.
- Abort
- Stops the solver immediately. This may prevent the solver from removing all scratch/temporary files and results files will not be available.
- Stop
- Terminate at the end of the current optimization iteration. All output files are created as if the run converged successfully.
- Pause
- Pause the run. OptiStruct will return the license.
- Results
- Provides an easy way to start the Framework (HyperGraph or HyperView) depending on which output files were created by the solver.
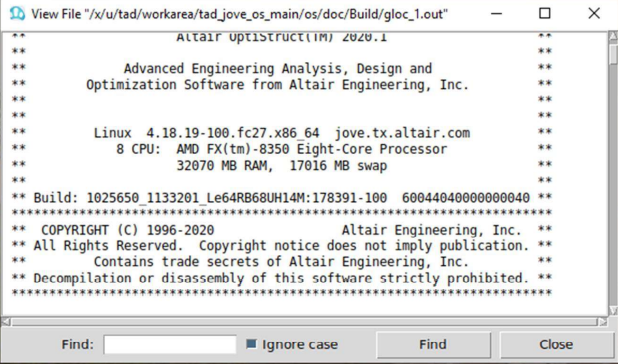
- View
- Allows you to select some other output files, either from the prepared list, or through the browser.
- Graph
- Allows you to select some other output files, either from the prepared list, or through the browser.
When the output filename(s) are changed by you; for example, by using the
-outfile command or by the controls in the input deck, the
Solver View utility will not be able to locate them automatically. The option can be used to view such output files.


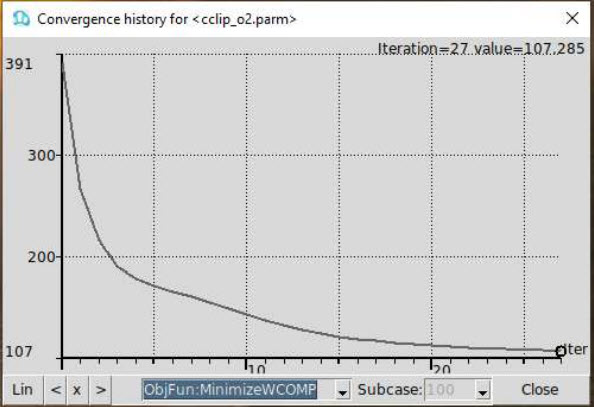
Graph window (activated by a ‘Graph’ button, if available) shows the history of convergence (optimization convergence or nonlinear iterations convergence) from the data shown in the Optimization summary window. The actual content depends on the solver; for example, for OptiStruct it will show optimization convergence, maximum displacement for a selected subcase, or convergence measures for nonlinear iterations. The purpose of this window is to help decide if the solution process progresses satisfactory, and potentially to terminate the job when solution does not converge.
The controls along the lower edge of the graph window allow to: toggle between the Linear and logarithmic scaling of values; zoom view toward the left or right edge of horizontal axis, reset view (x) and select specific function to display, and subcase ID (when applicable).
The Solver View form controls are solver dependent. Some fields and options are available only during runs using certain solvers. For example, the Message log, Optimization summary fields and the Graph button are displayed during OptiStruct runs. Stop, Abort, and other similar options appear only during OptiStruct and Radioss runs. AcuSolve run will show the Solution summary window, with Graph button, but not the Message log window.