Ranked Inputs

The purpose of Ranked Input is to provide overall contribution of each input variable.

The Ranked Inputs table is computed by averaging contribution of each displayed variable across all active responses. If the approach contains only a single output response, the Ranked Inputs table is identical to the Pareto Plot data. If interactions are included, contribution of interaction term is evenly divided between the two factors. For example, an A*B interaction term with 30% contribution means 15% contribution by A and 15% by B. The sum of all individual contributions is maximum of 1 which is 100%.

Here is an example of seven design variables with four active responses.

Design Variables: Diameter, Height, Thick Top, Thick Side, Cost Top Bot Material, Cost Side Material, Cost Rim Manufacturing

Responses: Area Top, Manufacturing Cost, Total Cost, Styling

In the Pareto Plot shown in Figure 1, only the top four factors are displayed. As a result, the Diameter, Height, Cost Rim Manufacturing, Cost Side Material, and Cost Top Bot Material variables are relevant.
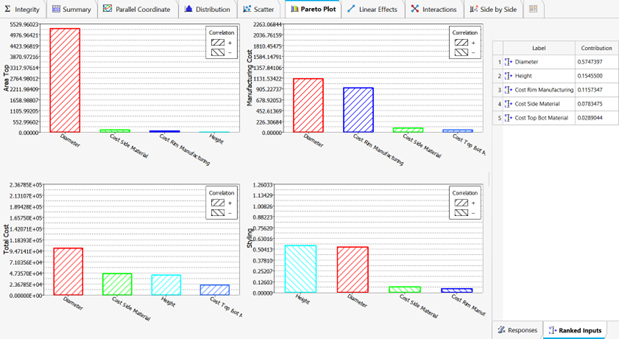
Figure 1.


Contribution of each factor is calculated as shown below.
  • %Contribution, DV =
Figure 2.
D V resp1 +D V resp2 ++D V respn n MathType@MTEF@5@5@+= feaahqart1ev3aqatCvAUfeBSjuyZL2yd9gzLbvyNv2CaerbuLwBLn hiov2DGi1BTfMBaeXatLxBI9gBaerbd9wDYLwzYbItLDharqqtubsr 4rNCHbGeaGqiVCI8FfYJH8YrFfeuY=Hhbbf9v8qqaqFr0xc9pk0xbb a9q8WqFfeaY=biLkVcLq=JHqpepeea0=as0Fb9pgeaYRXxe9vr0=vr 0=vqpWqaaeaabiGaciaacaqabeaadaqaaqaaaOqaaabaaaaaaaaape WaaSGaa8aabaWdbmaabmaapaqaa8qacaWGebGaamOva8aadaWgaaWc baWdbiaadkhacaWGLbGaam4CaiaadchacaaIXaaapaqabaGcpeGaey 4kaSIaamiraiaadAfapaWaaSbaaSqaa8qacaWGYbGaamyzaiaadoha caWGWbGaaGOmaaWdaeqaaOWdbiabgUcaRiabgAci8kabgUcaRiaads eacaWGwbWdamaaBaaaleaapeGaamOCaiaadwgacaWGZbGaamiCaiaa d6gaa8aabeaaaOWdbiaawIcacaGLPaaaa8aabaWdbiaad6gaaaaaaa@5144@
  • n MathType@MTEF@5@5@+= feaahqart1ev3aqatCvAUfeBSjuyZL2yd9gzLbvyNv2CaerbuLwBLn hiov2DGi1BTfMBaeXatLxBI9gBaerbd9wDYLwzYbItLDharqqtubsr 4rNCHbGeaGqiVCI8FfYJH8YrFfeuY=Hhbbf9v8qqaqFr0xc9pk0xbb a9q8WqFfeaY=biLkVcLq=JHqpepeea0=as0Fb9pgeaYRXxe9vr0=vr 0=vqpWqaaeaabiGaciaacaqabeaadaqaaqaaaOqaaabaaaaaaaaape GaamOBaaaa@36FC@ = number of responses
For Diamater
  • %Diameter =
Figure 3.
%   95.789332 + %   49.605229 + %   42.483907 + %   42.017422 4 MathType@MTEF@5@5@+= feaahqart1ev3aqatCvAUfeBSjuyZL2yd9gzLbvyNv2CaerbuLwBLn hiov2DGi1BTfMBaeXatLxBI9gBaerbd9wDYLwzYbItLDharqqtubsr 4rNCHbGeaGqiVCI8FfYJH8YrFfeuY=Hhbbf9v8qqaqFr0xc9pk0xbb a9q8WqFfeaY=biLkVcLq=JHqpepeea0=as0Fb9pgeaYRXxe9vr0=vr 0=vqpWqaaeaabiGaciaacaqabeaadaqaaqaaaOqaaabaaaaaaaaape WaaSGaa8aabaWdbmaabmaapaqaa8qacaGGLaGaaiiOaiaaiMdacaaI 1aGaaiOlaiaaiEdacaaI4aGaaGyoaiaaiodacaaIZaGaaGOmaiabgU caRiaacwcacaGGGcGaaGinaiaaiMdacaGGUaGaaGOnaiaaicdacaaI 1aGaaGOmaiaaikdacaaI5aGaey4kaSIaaiyjaiaacckacaaI0aGaaG Omaiaac6cacaaI0aGaaGioaiaaiodacaaI5aGaaGimaiaaiEdacqGH RaWkcaGGLaGaaiiOaiaaisdacaaIYaGaaiOlaiaaicdacaaIXaGaaG 4naiaaisdacaaIYaGaaGOmaaGaayjkaiaawMcaaaWdaeaapeGaaGin aaaaaaa@5D2F@
  • = 57.47397

By selecting inputs from this table, the corresponding inputs are highlighted in the Pareto Plot, and only their contribution is added into the cumulative contribution curve, Figure 2.

Figure 4.


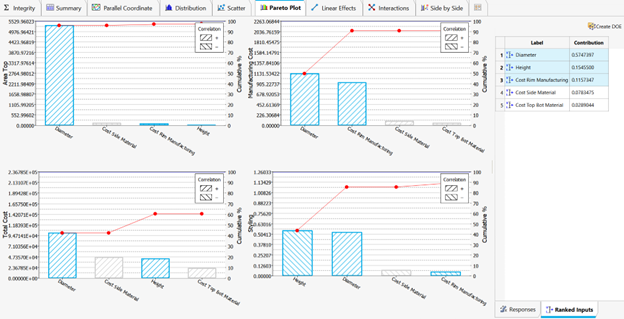
If the selected inputs exceed the configured contribution threshold, the contribution curve color changes to green. The Ranked Inputs table has a Create DOE button that will create a subsequent DOE with all selected ranked inputs as the only active approach input variables. This removes complexity from the study by disabling inputs with low overall contribution. Use this technique to decrease the number of runs needed for high quality fitting models.