Linear Effects Post Processing
Measure the result of a single variable moving.
Analyze Linear Effects
Analyze the effects of input variables on output responses while ignoring the effects of other input variables in the Linear Effects post processing tab.
Linear effects are calculated using a linear regression model for the normalized input variable ranges of [-1, 1]. The linear effect value of input variable x on output response f(x, y) doubles the coefficient a1 of the regression model for f(x)=a0+a1*x. This term, A1, can be written compactly as cov(x,y)/var(x)*(x_max-x_min).
- From the Post Processing step, click the Linear Effects tab.
- Using the Channel selector, select the input variable(s) and output response(s) to analyze.
-
Change the format to display linear effects by switching the view between
 (Linear Effects plot) and
  (Linear Effects Table).
- In the Linear Effects Plot view, effects are represented by the slope of a line.
- In the Linear Effects Table view, effects are presented in a tabular format.
- Analyze the linear effects.
Linear Effects Tab Settings
Settings to configure tables/plots displayed in the Linear Effects post processing tab.
- Normalize X-Axis
- Scatter
- Show scatter points in Linear Effects table.
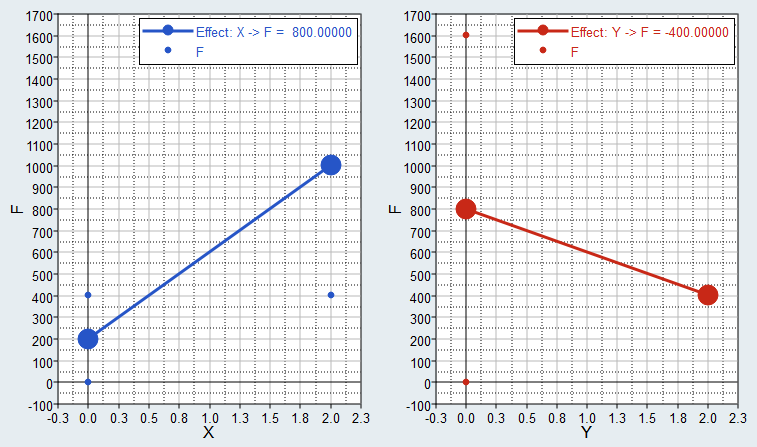
Example: Linear Effects
For two-level design of experiments, linear effect values can also be calculated as the difference between the average output responses when the input variable is at its lower value and when the input variable is at its upper value.
| Run | X | Y | F(X,Y) |
|---|---|---|---|
| 1 | 0 | 0 | 1 |
| 2 | 0 | 2 | 401 |
| 3 | 2 | 0 | 1601 |
| 4 | 2 | 2 | 401 |
- When X is at lower level, the mean output response is (1 + 401) / 2 = 201
- When X is at upper level, the mean output response is (1601 +401) / 2 = 1001
- The effect of X on F is then (1001 - 201) = 800
- When Y is at lower level, the mean output response is (1 + 1601) / 2 = 801
- When Y is at upper level, the mean output response is (401 + 401) / 2 = 401
- The effect of Y on F is then (401 - 801) = -400

