Visualize Results
Use the Results Explorer to view plots and contours for various result types.
-
To view the results of the most recent run, do one of the following:
- From the Run Status dialog, click View Current Results.
- From the Evaluate tool group, click the
Evaluate tool.
Figure 1. 
The Results Explorer is displayed.Figure 2. 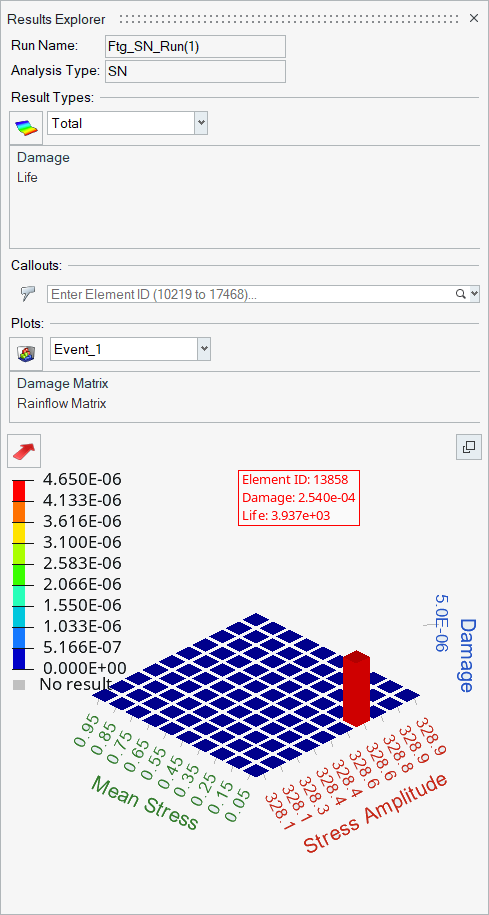
-
Choose the result type to contour.
By default, the fatigue results contour shows the total damage/life/safety factor/target stress, and so on.
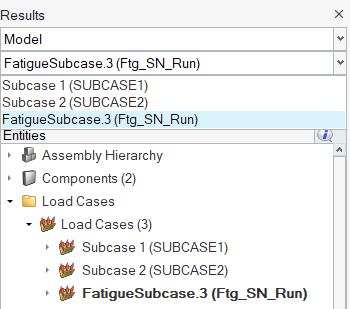
If the Output event wise results option is turned on in , you have the option to contour total fatigue results or fatigue results specific to an event.Figure 3. 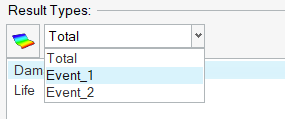
The visualization types dynamically update based on your selection from the drop-down menu.Figure 4. 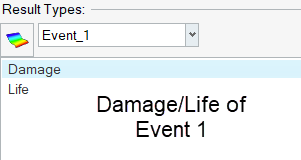
Note:- The damage shown per event/total is the final damage after multiplied with repeats.
- Session files (.hlf) will retain the fatigue results of each event computed.
-
Click
 to toggle the display of
results.
to toggle the display of
results.
-
Review effected elements in the modeling window.
A legend on the left side of the modeling window color codes damage/life values depending on the result type you select. It also displays the values and IDs of the maximum and minimum elements.Tip: The values in the legend can be edited to adjust the upper and lower bounds for each color band. Select and change a value then press Enter to dynamically update the legend.
For more information on editing the legend, see Additional Post-Processing Options.
Figure 5. 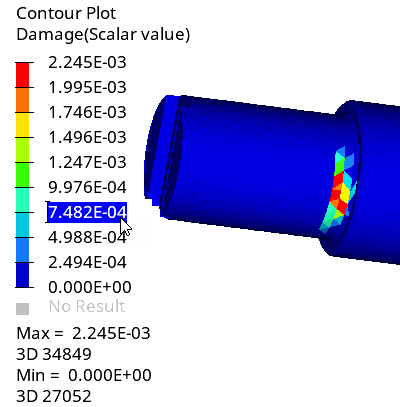
-
Review information for specific elements in the following ways:
- Enter an element ID in the Callouts text box. To highlight multiple elements, enter a comma separated list of IDs.
- Click
 and select elements in the
modeling window.
and select elements in the
modeling window.Figure 6. 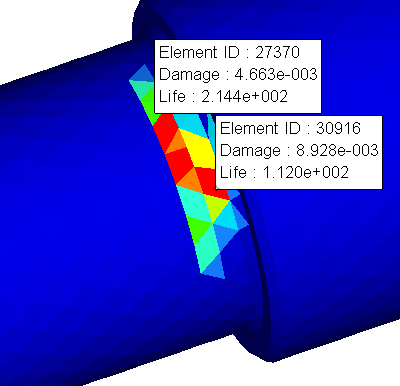
Right-click on an element ID and select Delete or Delete All to remove call outs.Note: Call outs on elements are specific to the event that's contoured. -
Plot a damage or rainflow matrix for specific elements and events by choosing
an event from the drop-down menu and defining a plot matrix type.
Click
 to
expand the matrix.
to
expand the matrix.By default, the maximum element is plotted. If you add a call out to an element, that element is plotted instead.
Note:- FOS calculations do not include damage or rainflow matrix plots.
- If the damage of the element from the fatigue event is zero, the damage matrix of the element for that event will be not be available.
- The result contour is not synched with the matrix plots. You should manually change the event toggle in the Plots section to updated the matrix.
- For EN Multiaxial Fatigue, if the strain of the element is larger than the maximum strain, a large damage (10.0) will be assigned to the element without going through the multiaxial damage calculation. In such scenarios, there will be no damage matrix displayed. It is highly recommended you check that the cyclic load is correct. If the cyclic load is correct, you can increase the maximum strain assigned in the Material tool.
- Damage results will show INF contour when damage magnitude is greater than 1e34.
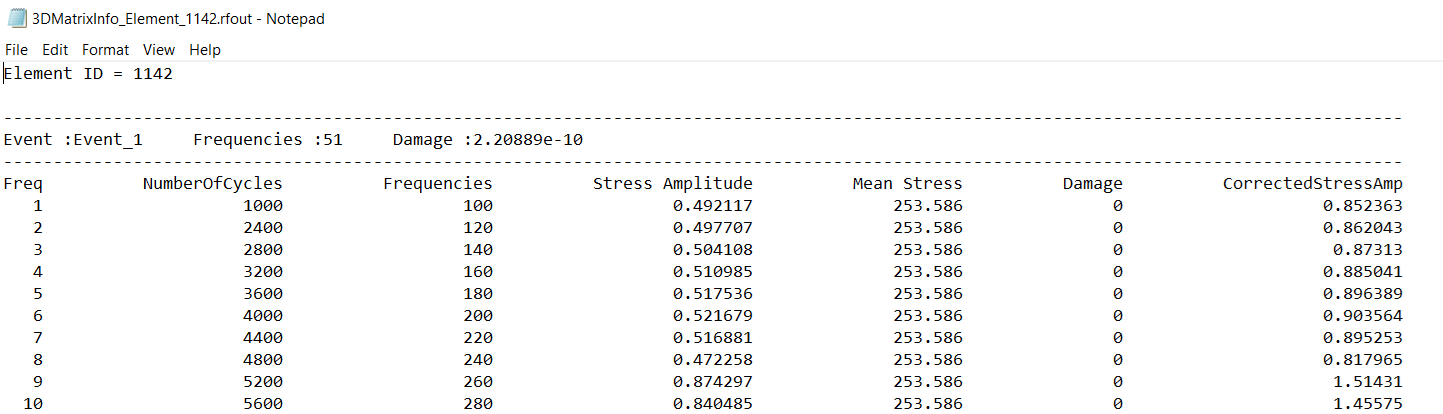
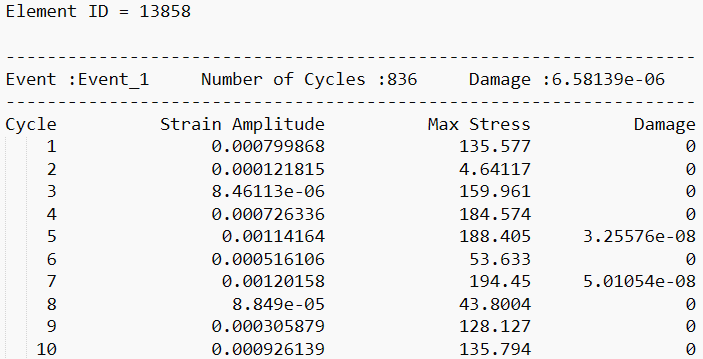
Export Damage and Rainflow Matrix Data
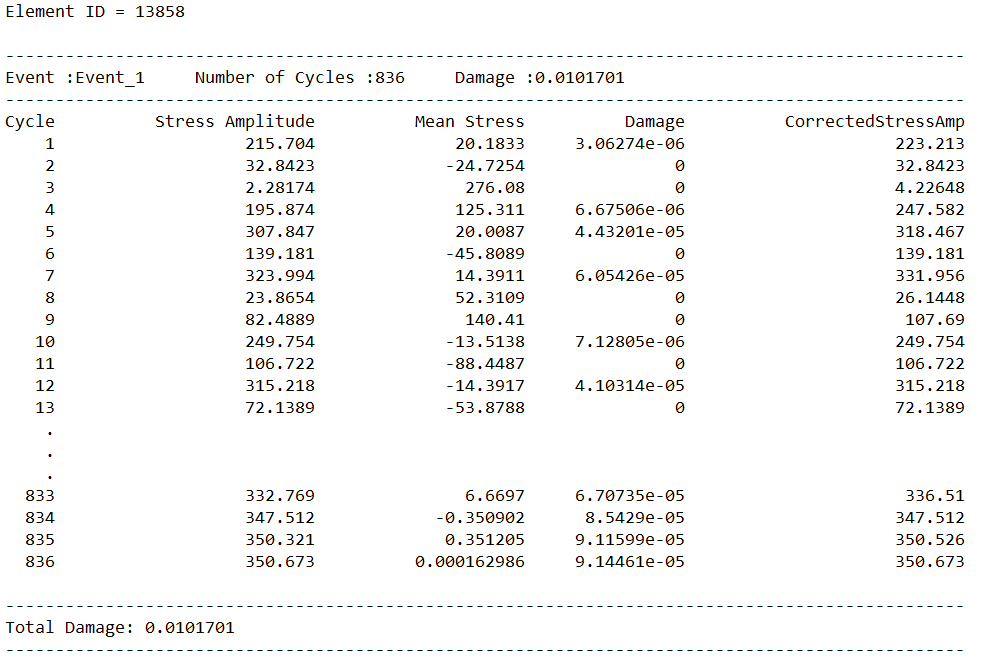
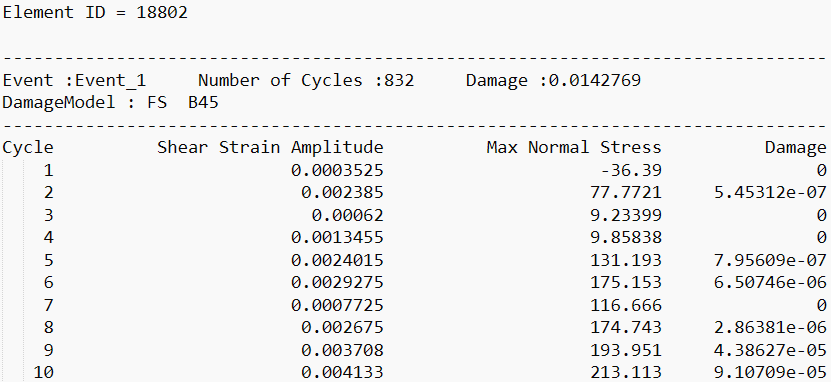
The *.rfout file contains the rainflow cycle count for each fatigue event for the queried element highlighted in damage/rainflow matrix.
The total damage, which is the cumulative damage, is written at the end of all event details.
- Element ID
- The element ID in consideration.
- Event
- The ID of the fatigue event.
- Number of Cycles
- Number of rainflow cycles detected for the current element in the current fatigue event.
- Damage (besides event header)
- Damage in the fatigue event.
- Cycle
- Rainflow cycle ID.
- Stress Amplitude
- Stress amplitude of the current cycle.
- Mean Stress
- Mean stress of the current cycle.
- Damage
- Damage value of the current cycle.
- CorrectedStressAmp
- Corrected Stress Amplitude based on mean stress model selected.Note: Corrected Stress Amplitude output is only supported for Time Series and Transient Response type of loading.
- Element ID
- The element ID in consideration.
- Event
- The ID of the fatigue event.
- Number of Cycles
- Number of rainflow cycles detected for the current element in the current fatigue event.
- Damage (besides event header)
- Damage in the fatigue event.
- Cycle
- Rainflow cycle ID.
- Strain Amplitude
- Strain amplitude of the current cycle.
- Max Stress (SWT)
- Max stress of the current cycle.
- Mean Stress (MORROW)
- Mean stress of the current cycle.Note: Based on the mean stress model selected, one of the above columns (Max stress or Mean Stress) will be available in the rainflow matrix.
- Damage
- Damage value of the current cycle.
- Element ID
- The element ID in consideration.
- Event
- The ID of the fatigue event.
- Number of Cycles
- Number of rainflow cycles detected for the current element in the current fatigue event.
- Damage (besides event header)
- Damage in the fatigue event.
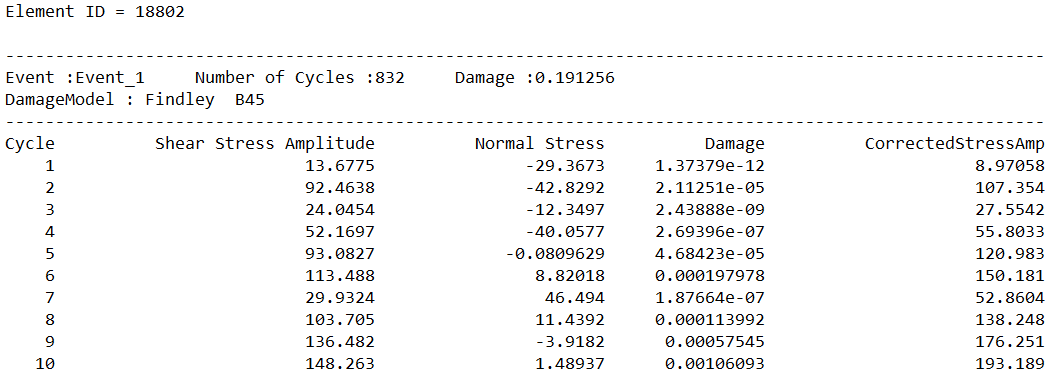
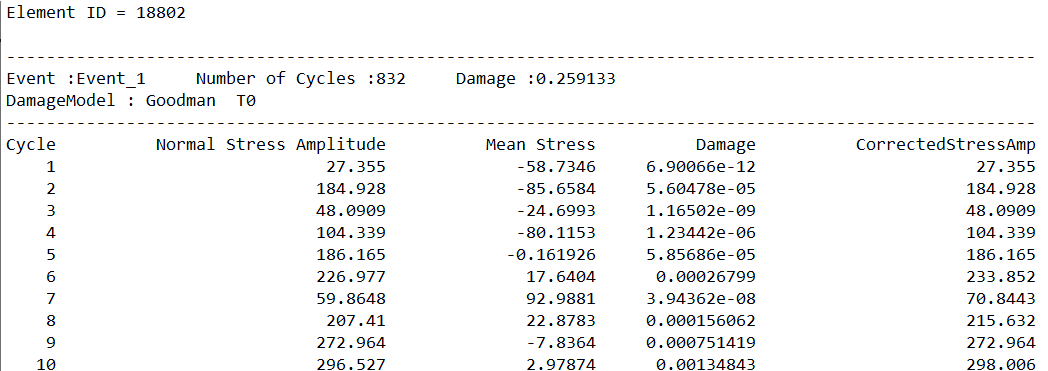
- Damage Model
- Damage model being used for this cycle. Additionally, it also lists the critical plane determined to have the maximum damage (possible planes are T0, A0, A45, B45).
- Cycle
- Rainflow cycle ID.
- Normal Stress Amplitude
- Stress amplitude of normal stress for the current cycle (Goodman).
- Mean Stress
- Mean stress of the current cycle (Goodman).
- Shear Stress Amplitude
- Stress amplitude for the current cycle (Findley).
- Normal Stress
- Normal stress of the current cycle (Findley).
- Damage
- Damage value of the current cycle.
- CorrectedStressAmp
- Corrected stress amplitude based on mean stress model selected.
- Element ID
- The element ID in consideration.
- Event
- The ID of the fatigue event.
- Number of Cycles
- Number of rainflow cycles detected for the current element in the current fatigue event.
- Damage (besides event header)
- Damage in the fatigue event.
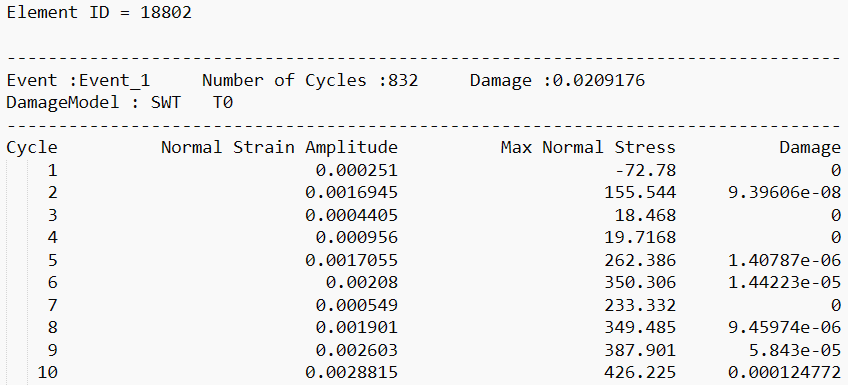
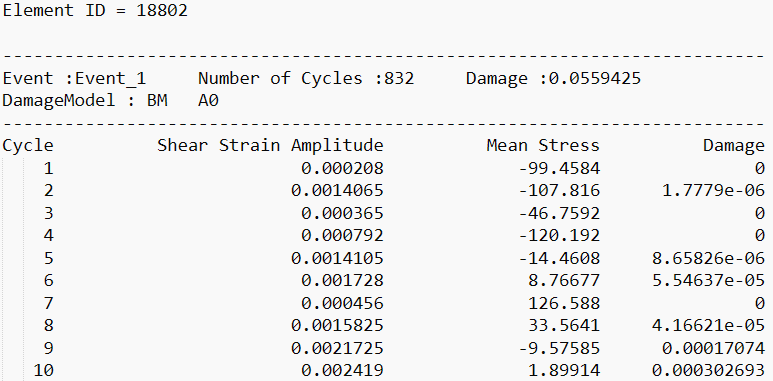
- Damage Model
- Damage model being used for this cycle. Additionally, it also lists the critical plane determined to have the maximum damage (possible planes are T0, A0, A45, B45).
- Cycle
- Rainflow cycle ID.
- Normal Strain Amplitude
- Strain amplitude of normal strain for the current cycle (SWT).
- Max Normal Stress
- Mean stress of the current cycle (SWT)
- Shear Strain Amplitude
- Strain amplitude for the current cycle (FS).
- Normal Stress
- Normal stress of the current cycle (FS).
- Shear Strain Amplitude
- Strain amplitude for the current cycle (BM).
- Mean Stress
- Mean stress of the current cycle (BM).
- Damage
- Damage value of the current cycle.
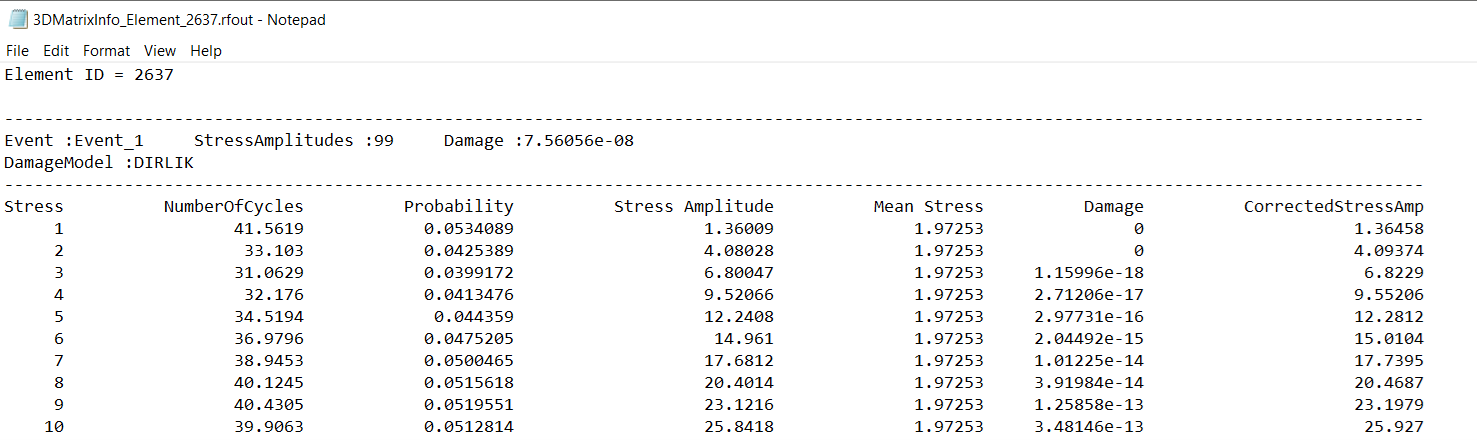
- Element ID
- The element ID in consideration.
- Event
- The ID of the fatigue event.
- Stress Amplitudes
- Number of stress amplitudes in the Random Response fatigue analysis for the current subcase.
- Damage (besides event header)
- Total damage in the event.
- Damage Model
- Random Response damage model used.
- Stress ID
- Rainflow cycle ID.
- Number of Cycles
- Number of cycles of the particular stress amplitude.
- Probability
- Probability of occurrence of the corresponding stress amplitude.
- Stress Amplitude
- Magnitude of stress amplitude.
- Mean Stress
- Magnitude of mean stress.
- Damage
- Cumulative damage value of all cycles at the current stress amplitude.
- CorrectedStressAmp
- Corrected stress amplitude based on mean stress model selected.
- Element ID
- The element ID in consideration.
- Event
- The ID of the fatigue event.
- Frequencies
- Number of frequencies in the Sine Sweep fatigue analysis for the current subcase.
- Damage (besides event header)
- Total damage in the event.
- Freq
- Number/ID of the current frequency of interest.
- Number of Cycles
- Number of cycles of the particular frequency of interest.
- Stress Amplitude
- Magnitude of stress amplitude.
- Mean Stress
- Magnitude of mean stress.
- Damage
- Cumulative damage value of all cycles at the current stress amplitude.
- CorrectedStressAmp
- Corrected stress amplitude based on mean stress model selected.