Evaluate the Model
Use the Run Analysis tool to set up and launch the evaluation.
-
From the Evaluate tool group, click the
Run Analysis tool.
Figure 1. 
The Evaluate dialog opens.Figure 2. 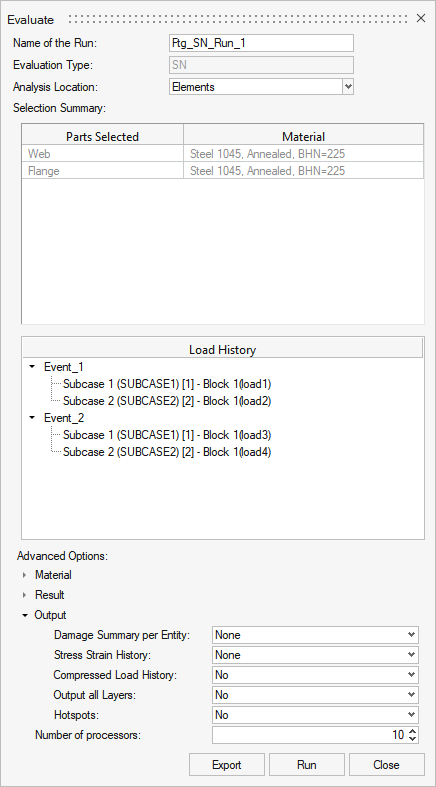
- Optional: Change the name of the run.
- For Analysis Location, select Elements/Nodes.
- Review the selected parts and loadcase.
- Optional:
Under Advanced Options and Material, define the material options.
- SN Curve Extrapolation can be set to True/False for Multiple SN curve interpolation.
- Multiple Haigh Interpolation Method options are Mean Stress = Constant or Stress Ratio = Constant.
- Optional:
Under Advanced Options and Result, you can calculate the safety factor for a
specified amount of target cycles for SN uniaxial runs.
- Change the Safety Factor drop-down to Stress Ratio = Const / Mean Stress = Const / Scale.
- Enter a value for the target cycles.
- Optional:
Under Advanced Options and Result, select the Scale Result.
You can scale Life based on Equivalent Lie units or scale Damage based on Allowable Miner Sum.
- Optional:
Under Advanced Options and Result, define the static failure options for
SN.
- Change to Continue or Stop for Static Failure options.
- Retain No Check to avoid Static Failure check.
-
Under Advanced Options and Result, define the static
failure transition cycle.
- Change to Stress or Life to control the Static failure transition cycle.
- Optional:
Define Advanced Options for output.
Supported only for Loading types: Time series, Transient, and Modal Superposition.
- Damage Summary per Entity: EventwiseDamage.csv will be written to Run folder. The option is activated when either a set or CSV with Element/Node IDs are assigned. The IDs are identified based on Analysis Location.
- Stress Strain History: Stress or Strain History based on Stress Life or
Strain Life selected is output to the Run folder in RSP format. The
option is activated when either a set or CSV with Element/Node IDs are
assigned. The IDs are identified based on Analysis Location.
- Option to disable damage calculation will be available upon request of Stress-Strain history output.
- Compressed Load History: Compressed load history file per event is output to the Run folder in RSP format. The option is activated by Yes/No.
- Output all Layers: Contour of fatigue results for all evaluated layers.
- HotSpots: Output Hotspot clusters (sets) of Elements/Nodes (based on
analysis location). On activation, the CSV sets will be written to run
directory. The following options are to be assigned:
- Number of Hotspots: number of hotspot clusters to be detected.
- Threshold Ratio: percentage of the max element damage used to create the required cluster.
- Damage Limit: entities with damage less than the damage limit will not participate in Hotspot creation.
Note: Hotspots are not supported for DangVan FOS and weld fatigue evaluation. - Optional:
Click Export to export a Batch Input File.
See for more information on batch submission.
- Optional: For a faster solution time, change the number of processors used for the run (based on availability).
-
Click Run.
The Run Status dialog opens.
Figure 3. 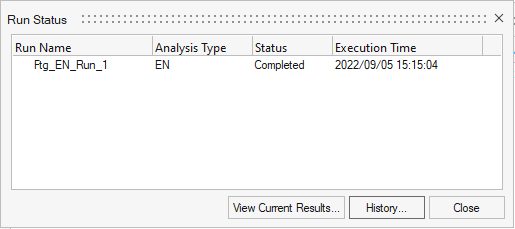
Note: If you do not assign any time history to an event, you are prompted about the missing channel when you click Run.
| File Type | Description |
|---|---|
| *.hlf | HyperLife Session File Details related to the fatigue setup are stored in this file. It's automatically written to the working directory upon completion of a fatigue evaluation.
|
| *.hwascii | HyperLife result output
|
| *.h5 | Rainflow/Damage matrix results
|
| 3DMatrixInfo_Ele<ID>.rfout 3DMatrixInfo_Node<43198>.rfout |
HyperLife ASCII format results file
for rainflow information of the queried element/node. This file is
created in the working directory after clicking the export icon
( For more information, see Export Damage and Rainflow Matrix Data |
| EventwiseDamage.csv | The damage summary lists damage of each entity (element/node) per event and per layer for the selected entity list. |
| StressHisOut_E<ID>_Event_1_<layer>.rsp | Stress or Strain history output which is not subjected to load history compression or Gate per layer and per event for the selected entity. |
| CompressedLoadHis_Event_1.rsp | Superposed load history from an event. Intermediate points which is neither peak or valley will be removed from the history, as they do not contribute in determining any stress cycle. |
| Hotspot<ID>.csv | Entity set (Elements/Nodes) for the hotspot cluster identified. |