Create Multiple SN Curves
The following methods are supported to create Multiple SN curves.
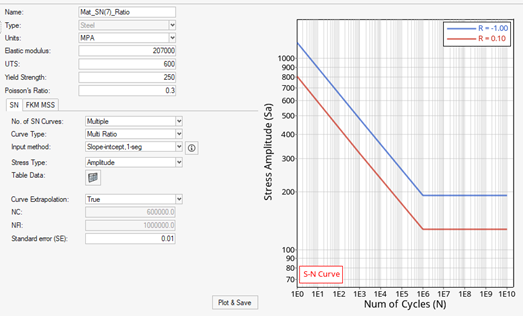
- From the Assign Material dialog, click the My Material tab and select your created material.
- Select Number of SN curves as Multiple.
- Select Curve Type as Multi Ratio/ Multi Mean Stress/ Multi Haigh Diagram.
- Select Input Method.
-
Define any necessary parameters.
Note: The images below use the default values as a guideline.
Multi Ratio Curves
Multiple stress life curves are defined at different values of stress ratio.
-
Select Input Method.
Options:
- Stress Intercept, 1-seg (multiple single sloped SN curves with respect to stress ratio)
- Stress Intercept, 2-seg (multiple two sloped SN curves with respect to stress ratio)
- XY Data (Xi, Yi data representing multiple SN curves with respect to stress ratio)
- Select Stress Type to select SN curve based on Amplitude/ Range/ Maximum Stress (Max).
-
Table Data: Input Table of single sloped SN curves with respect to stress
ratio.
Figure 2. Example of CSV Format 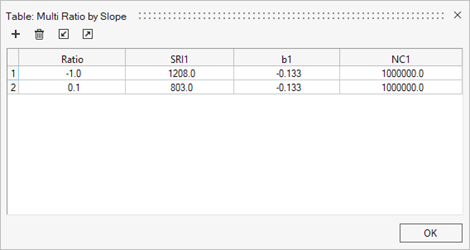
Note: Alternately, multiple .csv files of Stress Ratio SN curves can be imported.Figure 3. CSV Format of Two Slope Multiple Stress Ratio SN Curves 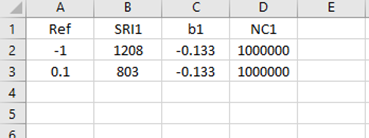
Figure 4. CSV Format of Multiple Stress Ratio SN Curves in XY Format 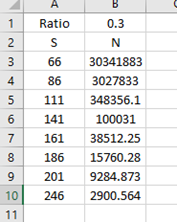
- Select Curve Extrapolation as True.
-
If XY Data curve:
NC : Fatigue transition point. After this point, fatigue strength is offset by the surface correction factor. Before this point, fatigue strength is proportionally reduced. (Default = 60000)
NFl : Endurance limit. Number of cycles at which damage can be considered zero. (Default = 100000000)
- Set SE to 0.0 to define Standard Error of log(Stress).
Multi Mean Stress Curves
Multiple stress life curves are defined at different values of mean stress.
-
From the following, select the Input Method.
- Stress Intercept,1-seg (multiple single sloped SN curves with respect to mean stress)
- Stress Intercept,2-seg (multiple two sloped SN curves with respect to mean stress)
- XY Data (Xi, Yi data representing multiple SN curves with respect to stress ratio)
- Select Stress Type to select SN curve based on Amplitude/ Range/ Maximum Stress (Max).
-
Table Data: Input Table of single sloped SN curves with respect to mean
stress.
Figure 5. Example of CSV Format 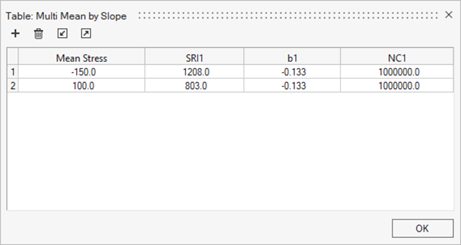
Note: Alternately, multiple .csv files of Stress Ratio SN curves can be imported.Figure 6. CSV Format of Two Slope Multiple Mean Stress SN Curves 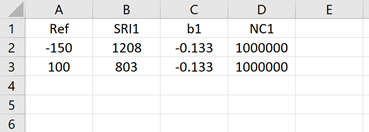
Figure 7. CSV Format of Multiple Mean Stress SN Curves in XY Format
- Select Curve Extrapolation as True.
-
If XY Data curve:
NC: Fatigue transition point. After this point, fatigue strength is offset by the surface correction factor. Before this point, fatigue strength is proportionally reduced. (Default = 60000)
NFl : Endurance limit. Number of cycles at which damage can be considered zero. (Default = 100000000)
- Set SE to 0.0 to define Standard Error of log(Stress).
Multi Haigh Diagrams
Multiple Haigh Diagrams are defined at different values Life.
- Select Stress Type to select Haigh Diagram based on Amplitude/ Range/ Maximum Stress (Max).
-
Select Table Data: Input Life and the number of point and click
 .
.
-
Enter Sm vs Sa table and click Update.
Figure 8. Example of CSV Format 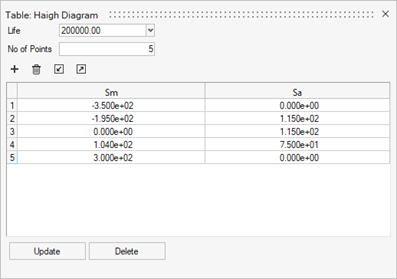
Note: Alternately, import of CV table.Figure 9. CSV Format of a Single Haigh Diagram 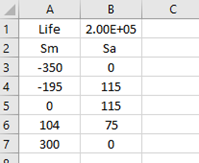
- Click the Life drop-down and click Add new.
- Enter the new life and repeat the process to save New Haigh Diagram.
- Select Curve Extrapolation as True.
-
If XY Data curve:
NC : Fatigue transition point. After this point, fatigue strength is offset by the surface correction factor. Before this point, fatigue strength is proportionally reduced. (Default = 60000)
NFl : Endurance limit. Number of cycles at which damage can be considered zero. (Default = 100000000)
- Set SE to 0.0 to define Standard Error of log(Stress).