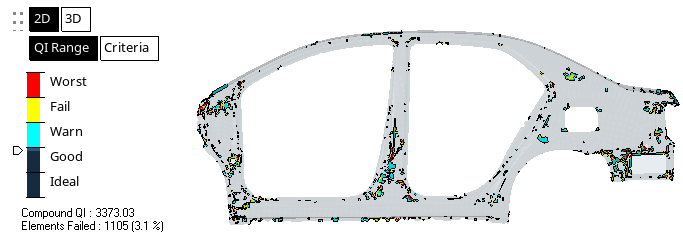
Use the QI (Quality Index) Range legend to categorize overall element quality as
Worst, Fail, Warn, Good, and Ideal.
Restriction: The QI Range is not available for 3D
elements.
Click QI Range from the legend.
The color of elements changes according to how well they adhere to the
pre-set quality requirements. The quality of the shell model is calculated as a
single value based on different categories (worst, fail, warn, good and ideal)
defined in the criteria file.
Move the slider to highlight all of the elements at or below a certain quality
level.
For example, setting the slider to Warn highlights
all elements in the model whose assessed quality level is Warn or Worst; in
other words, elements at the warn, fail, and worst quality levels will be
highlighted.Figure 1.
Tip: Change the display of elements that are out of range by right-clicking
on the legend and selecting Out of Range from the context menu. This is useful when you want to select elements of
interest, for example, only failed elements, by setting the entity selector to Elements and then
selecting elements by window or displayed.
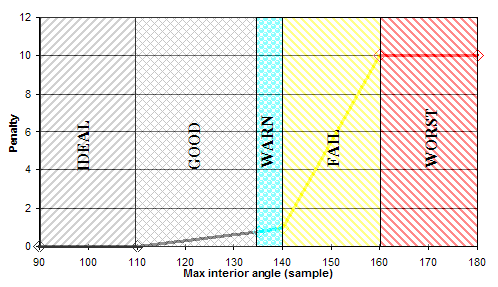
Quality Index Calculations
The Quality Index value is a function of twelve criteria with user-defined weight
factors. Each criterion has five rating levels.
HyperMesh CFD assigns a penalty value to each element according to its rating
for individual criteria. The elements that fail a criterion are assigned a penalty
of 1.0 to 10.0 as a linear function of how far the element is from satisfying the
criterion. The elements that pass a criterion are assigned a penalty value of 0.0 to
1.0 for that criterion. The quality index (Q.I.) is a function of individual
criteria penalty values. Each element is assigned the corresponding element Q.I.
color.
element Q.I.
(weighted average of penalties that pass) + (weighted sum of penalties
that fail)
criteria Q.I.
(weighted average of penalties of elements that pass) + (weighted sum of
penalties of elements that fail)
compound Q.I
(weighted average of criteria Q.I. that pass) + (weighted sum of
criteria Q.I. that fail)
All of this means that higher compound Q.I. values indicate worse quality.
Each criterion has five levels. The elements are assigned a penalty depending on
where they fall in these levels.Figure 2. Criterion Levels
Ideal
The absolute best/ideal value that an element can achieve. For example,
an ideal element would have an aspect ratio of 1.0, warpage of 0.0,
jacobian of 1.0, and so on. Some criteria may not have an ideal, for
example the ideal minimum element size is the same as average element
size. Similarly, for simulations that require all triangular mesh, "% of
trias" is not applicable. Thus, the ideal "% of trias" depends on the
analysis type, and should be set by you. Elements that fall in this
level are drawn in their default color, not highlighted. Ideal elements
have no penalty assigned to them.
Good
This level is slightly worse than ideal but is still considered good for
the required analysis. All elements whose criteria are equal to or
better than this level are considered good and no penalty is assigned to
them. You set all the good level thresholds. Elements that fall in this
level, between good and warn, are drawn in their default color, not
highlighted. The elements that fall between good and warn are assigned a
penalty between 0-0.79.
Warn
An intermediate level between good and fail. This level is used to
highlight the elements that have not failed the criteria but are close
to it. HyperMesh CFD sets these values at 80 percent
between good and fail levels. The elements that are in this level, that
is, falling between warn and fail, are drawn in cyan by default and are
assigned a penalty value between 0.8 – 0.99.
Fail
Determines the elements that are considered to be unacceptable for
analysis, thus failed. It is recommended that you fix these elements
before performing the analysis. You can specify the fail levels. All the
elements that fail are given a penalty greater than 1.0. The penalty
value is calculated depending on the severity of the failure. The
elements that have failed, between fail and worst, are drawn in yellow
by default and are given a penalty value between 1.0-10.0. Therefore,
elements that passed all criteria have a penalty less than 1.0.
Worst
Highlights elements that failed the criteria by a large margin, and
which require immediate attention. The worst levels are set by HyperMesh CFD as a factor of good and fail
values. The elements that fall in and beyond this worst level are drawn
in red and given a flat penalty value of 10.0.
In addition to these levels, you can also turn on/off individual criteria
according to your analysis requirements. You can also set different weights for
individual criteria. For example, if jacobian is relatively more important than
warpage, you can choose to set jacobian comp weight to 2.0. The Comp QI calculated
will then give jacobian twice the weight as the remaining criteria.