View Section Cuts
View the generated preview of a section cut.
- Open a model file and expand the 3D viewer.
-
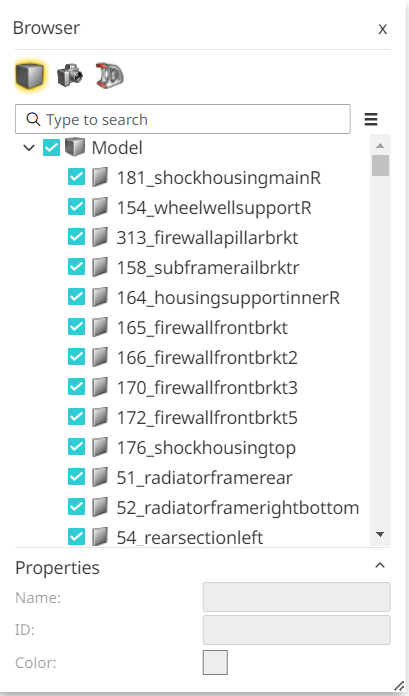
Click Show/Hide Browser.

Figure 1. Show/Hide BrowserThe Browser window displays the model parts of a 3D model.
Figure 2. Browser -
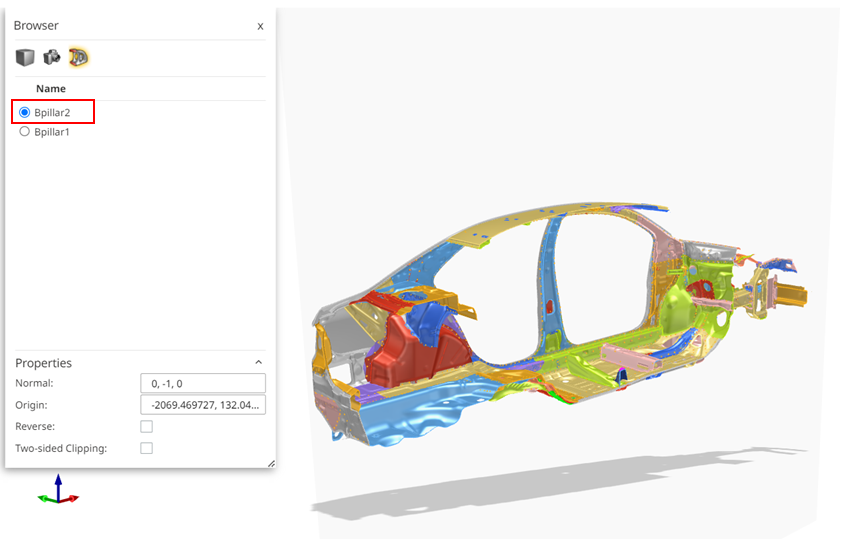
Click Sections.
 Figure 3. SectionThe Sections pane display the sections you created.
 -
Select the name of the section to view its preview.

Figure 4. View Sections -
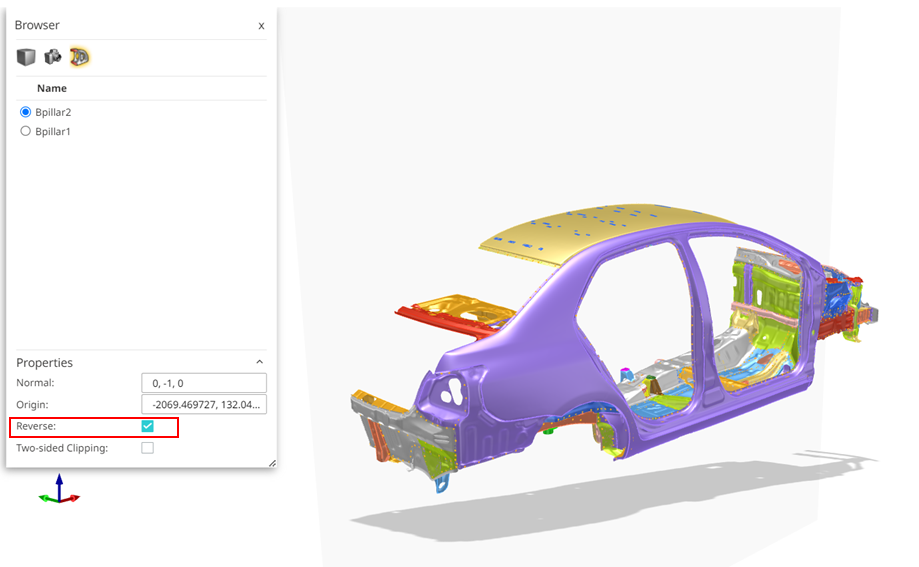
Select the Reverse check box to preview the model in
reverse.

Figure 5. Section Preview in Reverse -
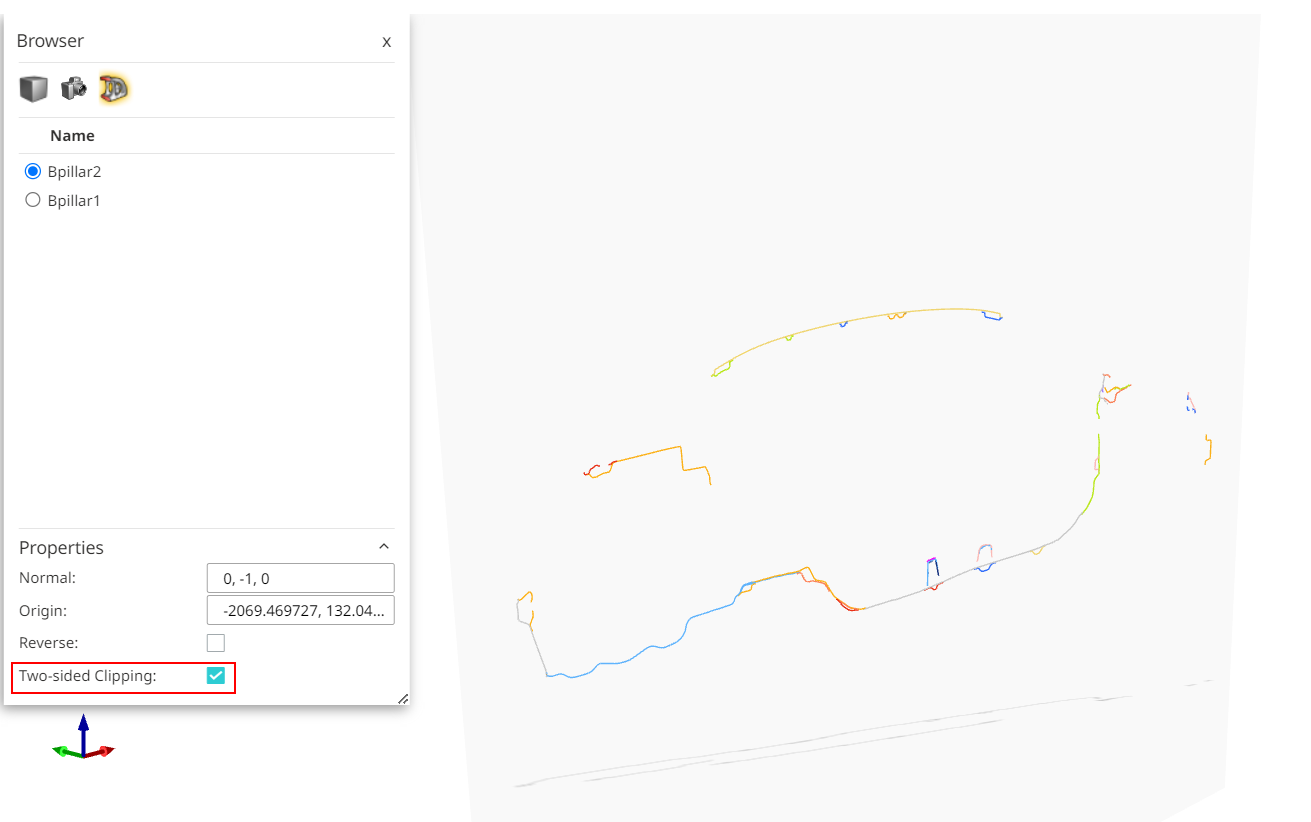
Select the Two-sided Clipping check box to preview the
section cuts.

Figure 6. Two-sided ClippingNote: Only the parts which are intersected by the section plane are visible in the section cut view.