Visualize Simulation Results Using the Result Browser
The Result Browser enables you to visualize results for model files containing simulation data for results, load cases and result types. You can customize legends for color and precision, show and hide contours and add callouts to the model for effective analysis and visualization.
-
Click Result Browser (
 ).
Simulation data results of the 3D model are displayed.
).
Simulation data results of the 3D model are displayed.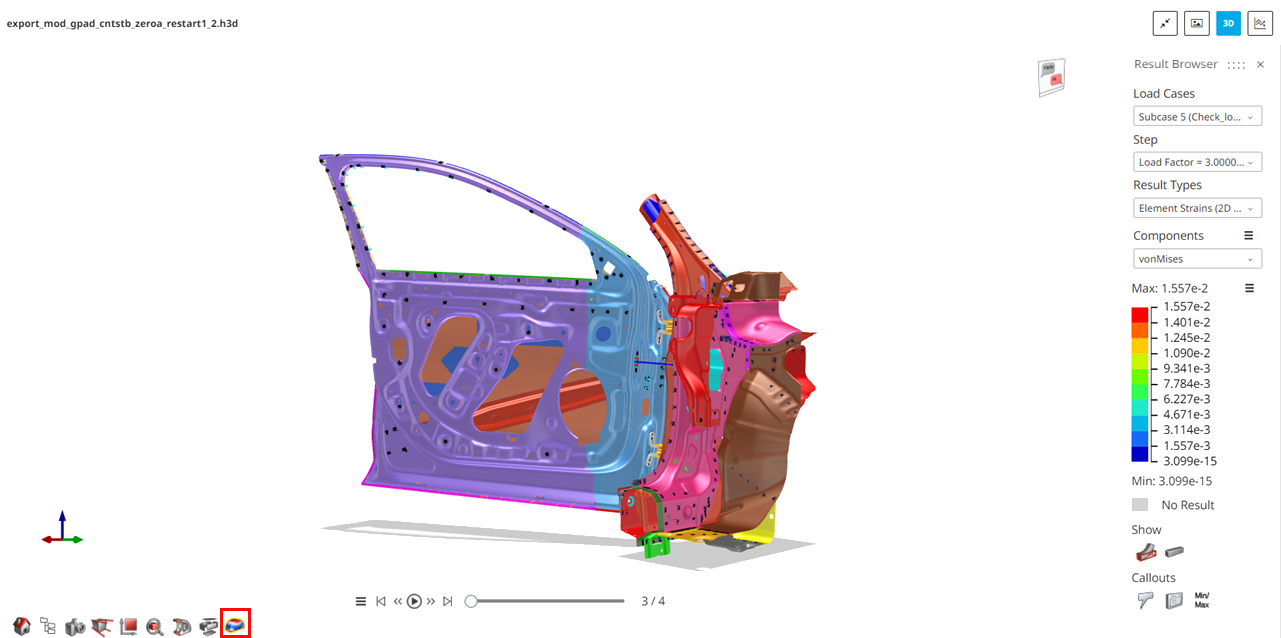 Figure 1. Result Browser
 -
Select a corresponding Component.
-
Visualize the advanced settings for the selected result type.
Click
 beside the Component field. The Advanced
Settings dialog box is displayed.
beside the Component field. The Advanced
Settings dialog box is displayed.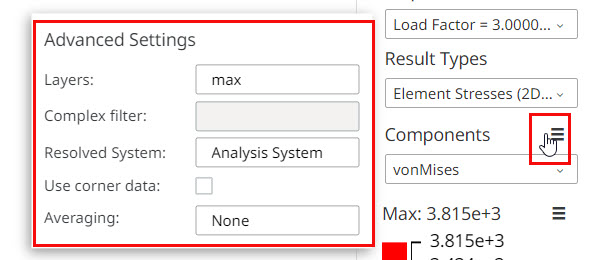 Figure 2. Advanced Settings
-
Visualize the advanced settings for the selected result type.
-
Modify the legend settings to analyze the model.
- Click beside the contour colours.
The Legend Settings dialog box is displayed.
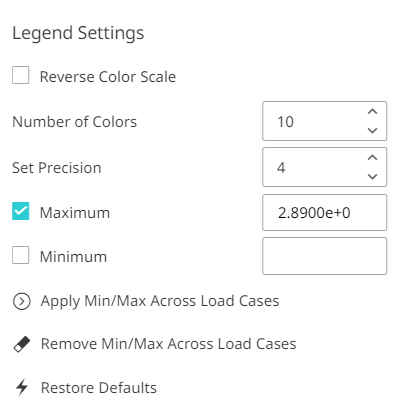
Figure 3. Legend Settings - Reverse Color Scale reverses the legend values assigned to the contour bands.
- Number of Colors displays more or less contours bands along with their respective ranges. The minimum number of bands you can display in a legend is 4; the maximum is 32.
- Set Precision for the result values. You can increment the current value from 1 to 8 decimal points.
- Minimum/Maximum legend values. You can modify the minimum and maximum legend values to analyze the model details for the selected result type.
- Apply Min/Max Across Load Cases to apply the min/max values for the current result type to all load cases.
- Remove Min/Max Across Load Cases to remove min/max values for the current result type to all load cases.
- Restore Defaults The changes made in the
legend settings are retained for the rest of the session and the
button changes to blue
 . Restores defaults will reset the
legend settings to the default values for the selected result type
and the button changes to black .
. Restores defaults will reset the
legend settings to the default values for the selected result type
and the button changes to black .
- Click
-
Click
 to show or hide the initial shape as a
reference.
to show or hide the initial shape as a
reference.
-
Click
 to
show or hide contour shapes for the selected result.
to
show or hide contour shapes for the selected result.
-
Click
 then click a point on model to create a visual callout.
The callout shows the contour value.Note: Click again to show or hide the callouts you created.
then click a point on model to create a visual callout.
The callout shows the contour value.Note: Click again to show or hide the callouts you created. -
Click
 to view all the callouts with the result type,
contour value and part name in a table format.
to view all the callouts with the result type,
contour value and part name in a table format.
-
Click
 to show or hide the minimum and maximum datapoint
values for the selected result type.
The callouts, callouts table and the minimum and maximum datapoint values are displayed in the image.
to show or hide the minimum and maximum datapoint
values for the selected result type.
The callouts, callouts table and the minimum and maximum datapoint values are displayed in the image.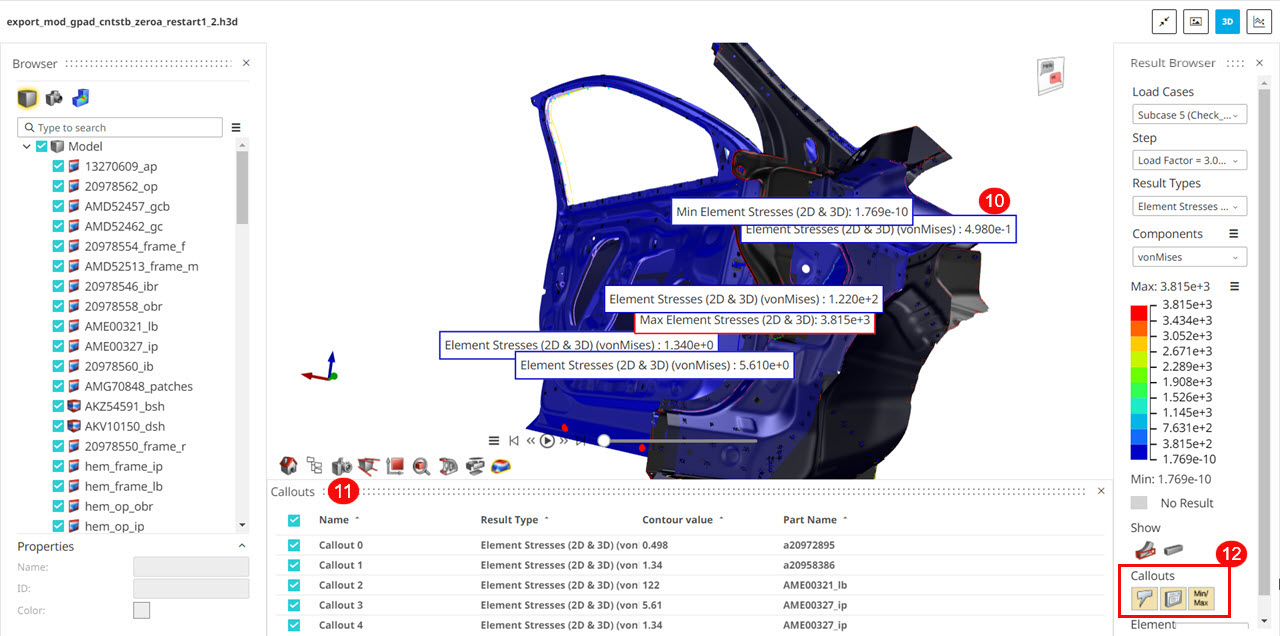 Figure 4. Callouts