Create Plots
Extract plot data such as table of contents, result types, subcases, and components using the result files which has plot data. View or compare result types in a single or multi-plot layouts.
-
Open the Info panel and click
Plots
 .
.
-
Click Extract Plot Data.
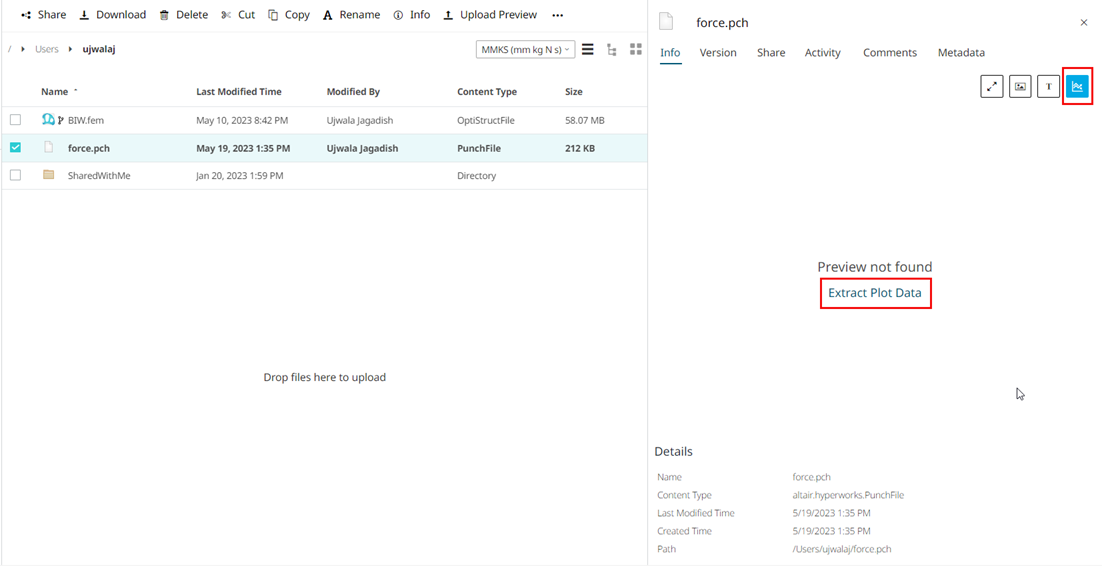
Figure 1. Open Plots -
The job is complete and to view the extracted data, click Open Plot
Data.
The Define Plots dialog box is displayed.
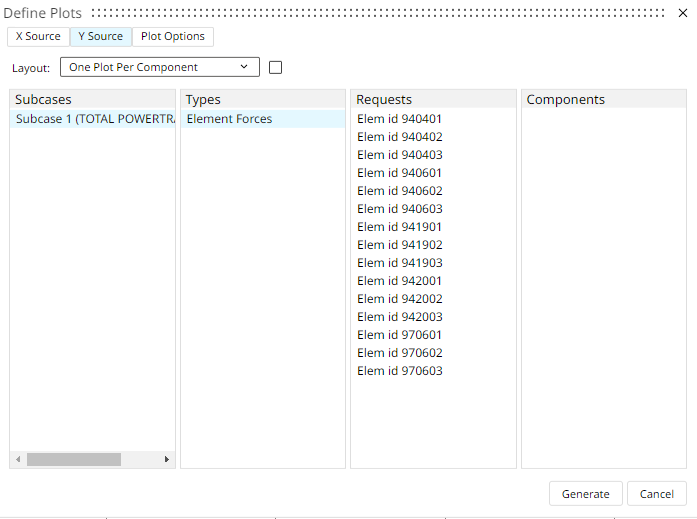
Figure 2. Define X and Y Axis -
Click
 to
select the page layout.
The following page layout options are displayed.
to
select the page layout.
The following page layout options are displayed.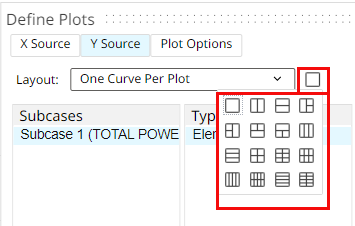
Figure 3. Page Layouts for PlotsFor example, select the layout as One Plot Per Component with the page layout .
.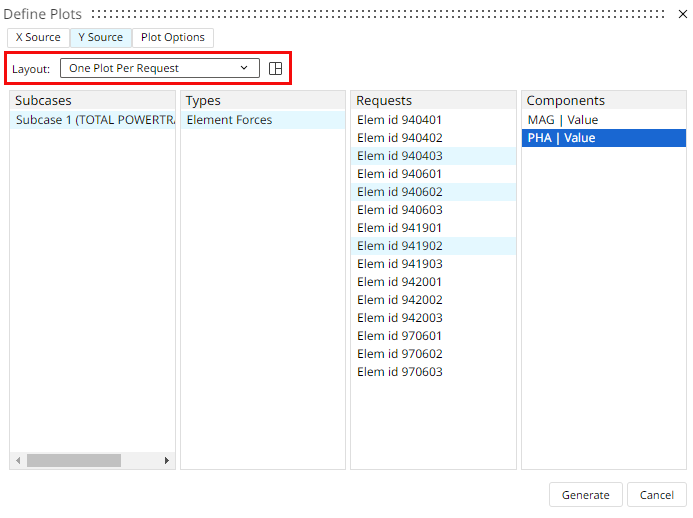
Figure 4. Select Layout - Optional:
To set the plot preferences, click Plot Options, select
the preference value for each Category.
Figure 5. Plot Options -
Click Generate.
The plot data is displayed and is saved under a new page.
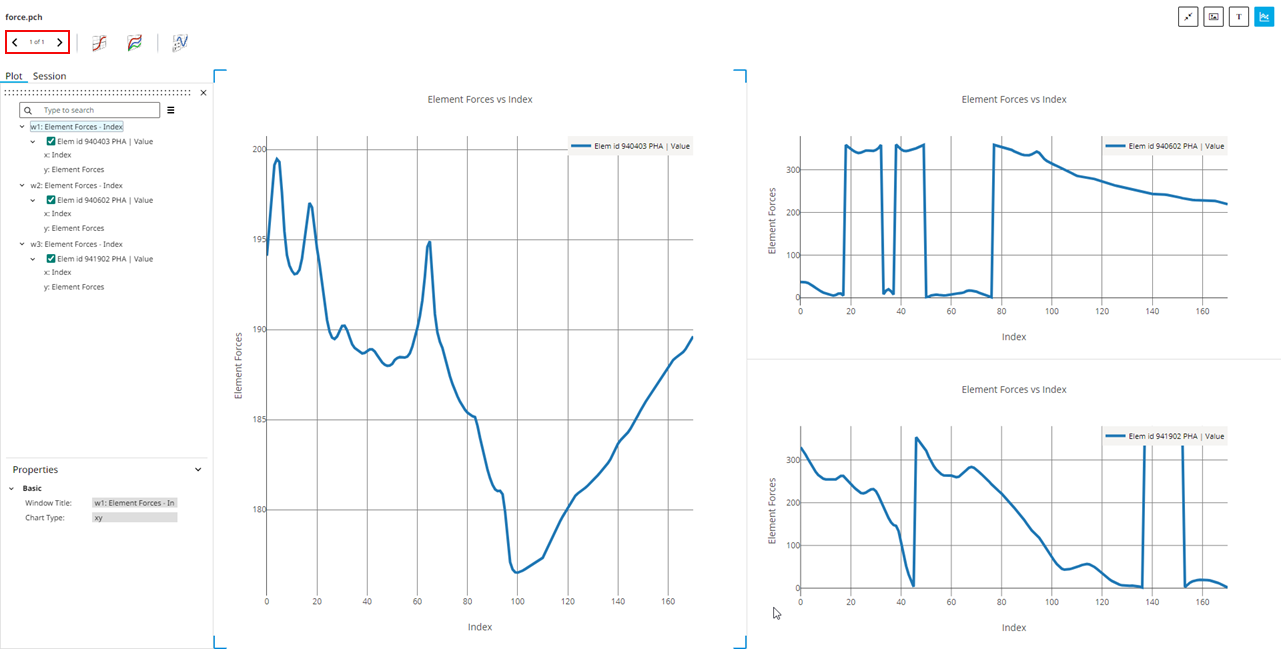
Figure 6. Generated PlotOn the left pane, the Plot browser displays the number of windows and its plot data. The Properties section displays the selected plot window title and the chart type.
-
On the left pane, select Session.
The Session browser displays the plot data with the page number. The selected window plot data and its plot preferences are displayed.
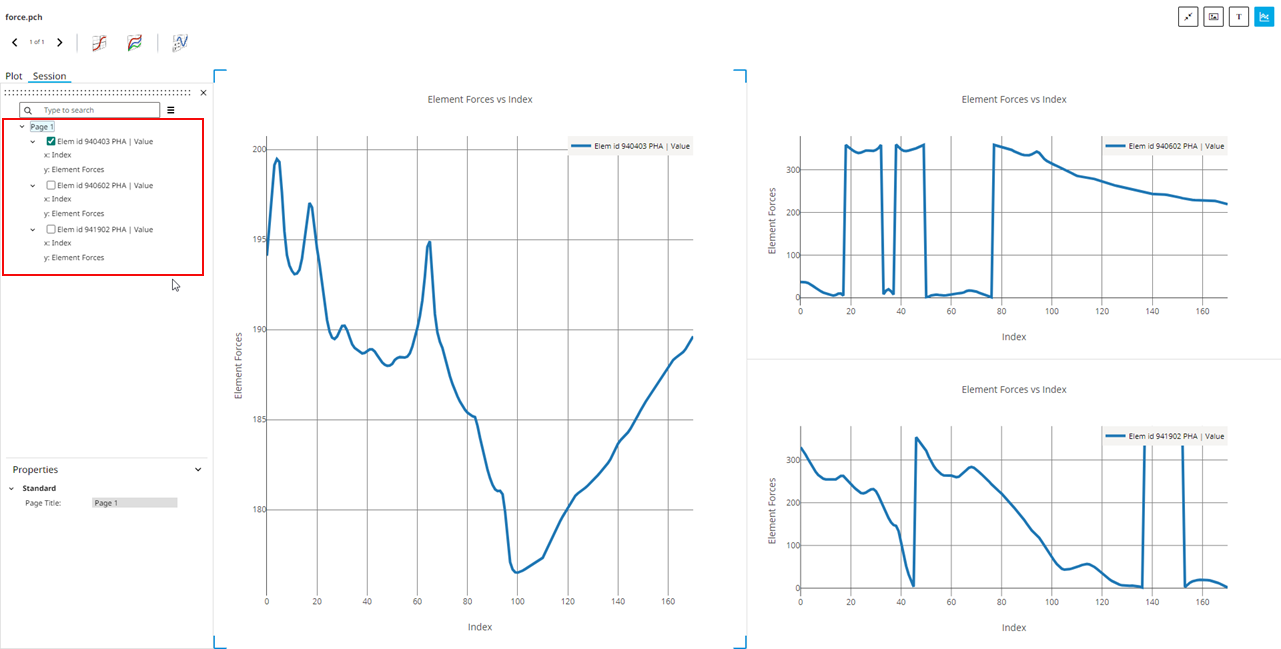
Figure 7. Plot Data and PreferencesNote: The selected window corners are highlighted in the plot layout.Hover over a plot to view plot toolbar
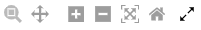 . The following table explains the usage of
it:
. The following table explains the usage of
it:Icon Description 
By default, Zoom is enabled to zoom in and zoom out. Drag a square on a plot area to zoom in. Double click to zoom out. 
Click to pan the plot curves. 
Click to zoom in the plot curves. 
Click to zoom out the plot curves. 
Click to auto scale the plot curve's view. 
Click to reset the axes of a plot. - Optional:
Modify the X and Y Source, plot layout, and generate to view the new plot
result.
The new plot data is saved under a new page.
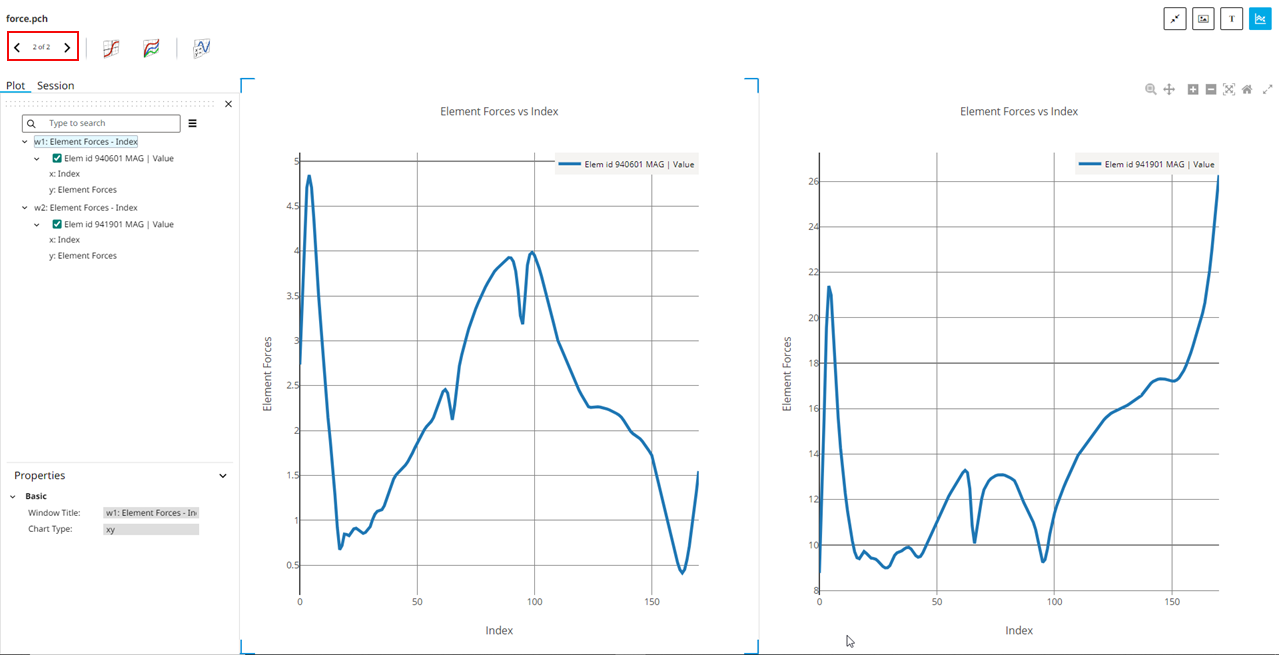
Figure 8. Modify XY Source and GenerateNote: Use the arrow keys to view the specific plot data. -
In the Session browser, you can rename a page and delete the page with
the plot data.
Right-click the page number and choose the required option.
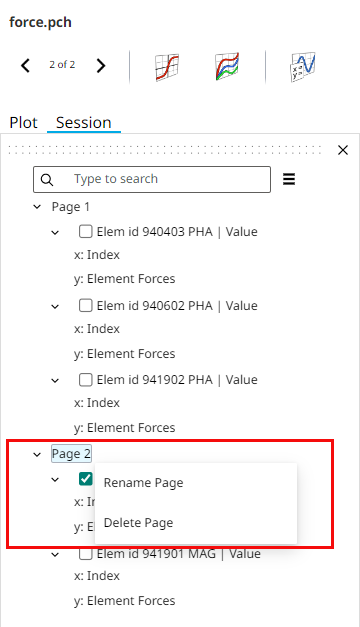
Figure 9. Rename or Delete Plot Data