Adjust Plot View
Adjust the plot view to analyze the material property data.
-
Choose one of the following:
- Double-click the material.
- Hover over a material, click

A window opens to the right.By default, the Info tab displays general information of the selected material.Note: Click to view the material information in a full
screen mode.
to view the material information in a full
screen mode. -
Select the required material data under the Plots list.
The selected material data is displayed as a plot.
Drag a square using the cursor point to zoom the curve plots to read the data. Double-click the cursor point to reset the axes of a plot.
Hover over the plot, as you move the cursor, the X and Y values are displayed.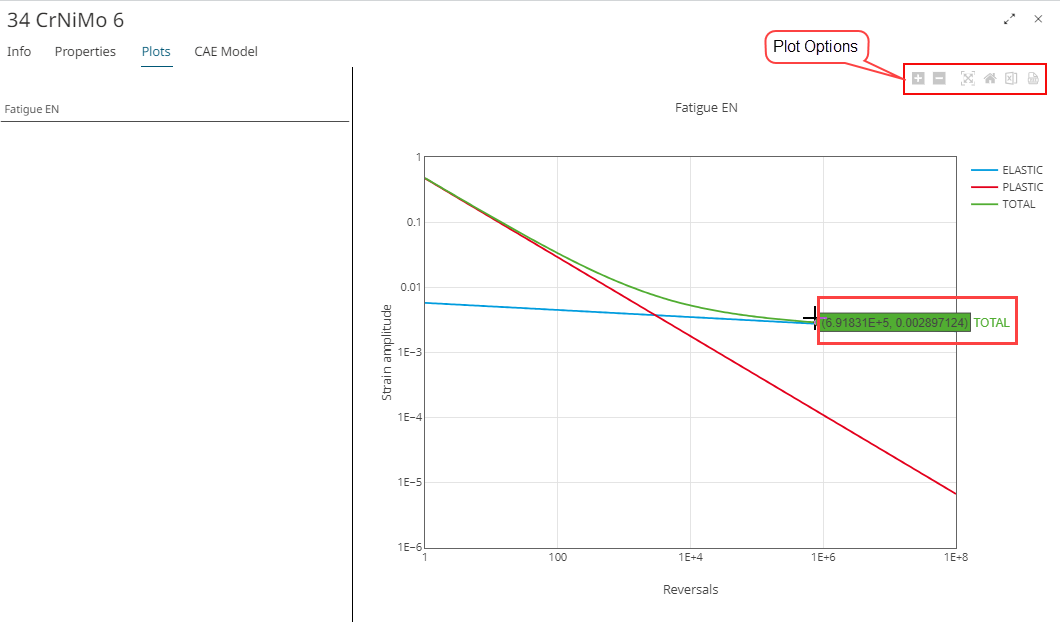
Figure 1. Plot DetailsAs you move the cursor on the plot, the plot options menu is displayed. The following table explains the usage of plot options:
Icon Description 
Click to zoom in the plot curves. 
Click to zoom out the plot curves. 
Click to auto scale the plot curve's view. 
Click to reset the axes of a plot. 
Click to export the plot data into a CSV file. 
Click to export the plot data into a PDF file.