Global Warming Potential
The environmental impact of a material is indicated in its carbon footprint and Global Warming Potential (GWP).
-
Select a material type in the filter pane.
The search result is displayed with the list of materials that matches your selection.
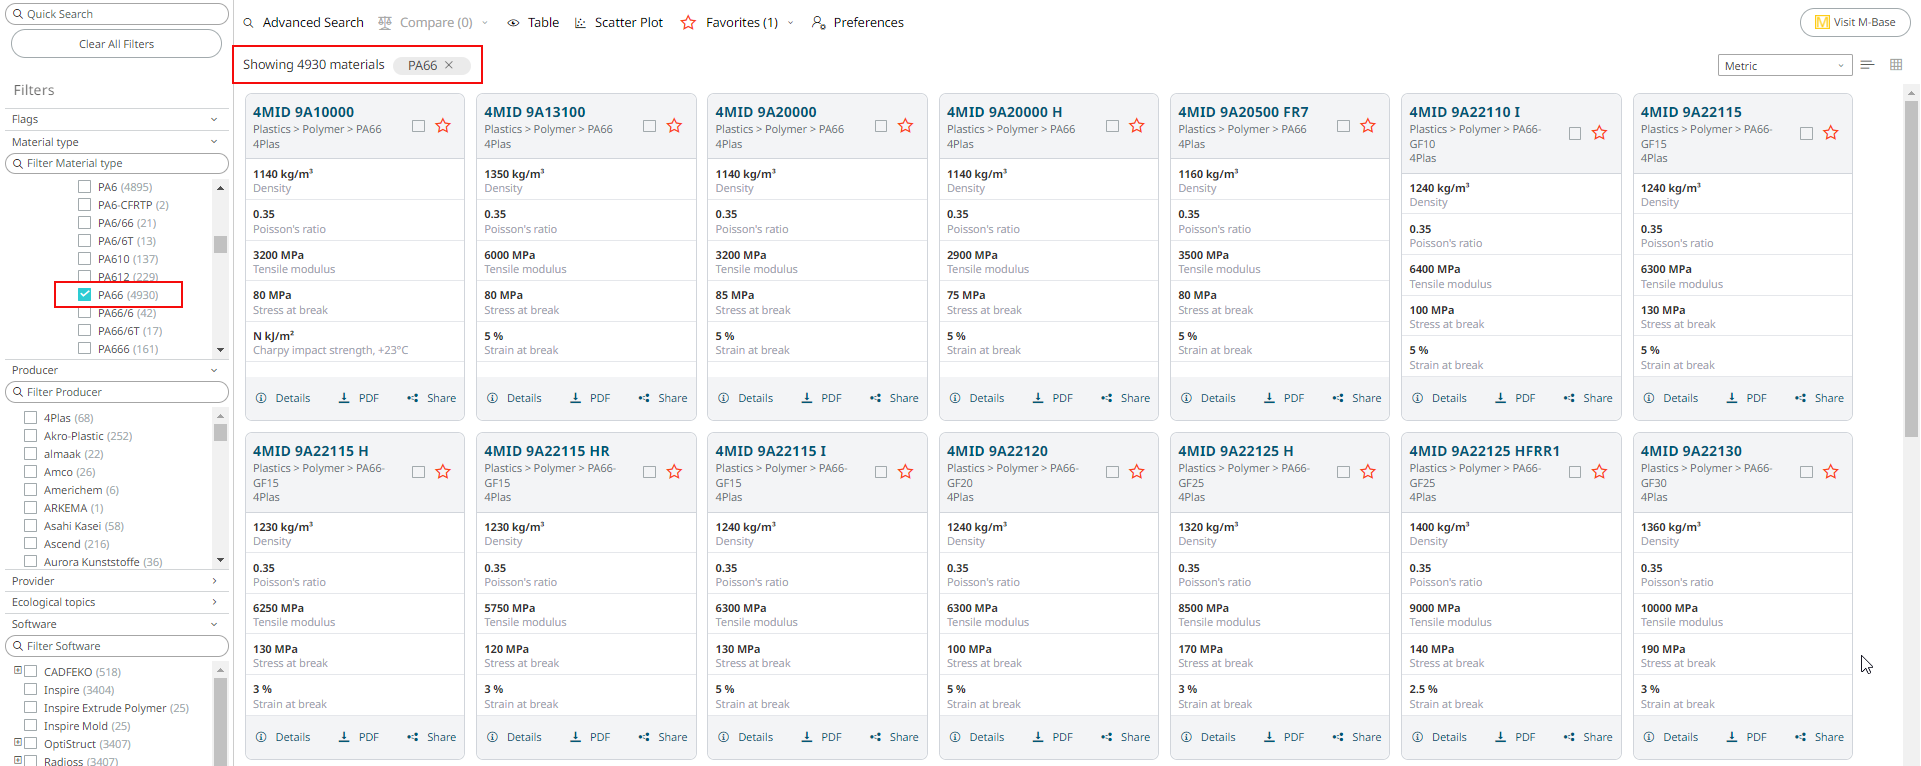
Figure 1. Filter Materials -
Select a material and click
 The Info tab displays general information about the selected material.
 -
Click LCA(CO2).
The filtered material is selected as a compound material with its ratio in percentage, and the generic data of GWP and carbon footprint for the compound material are displayed.
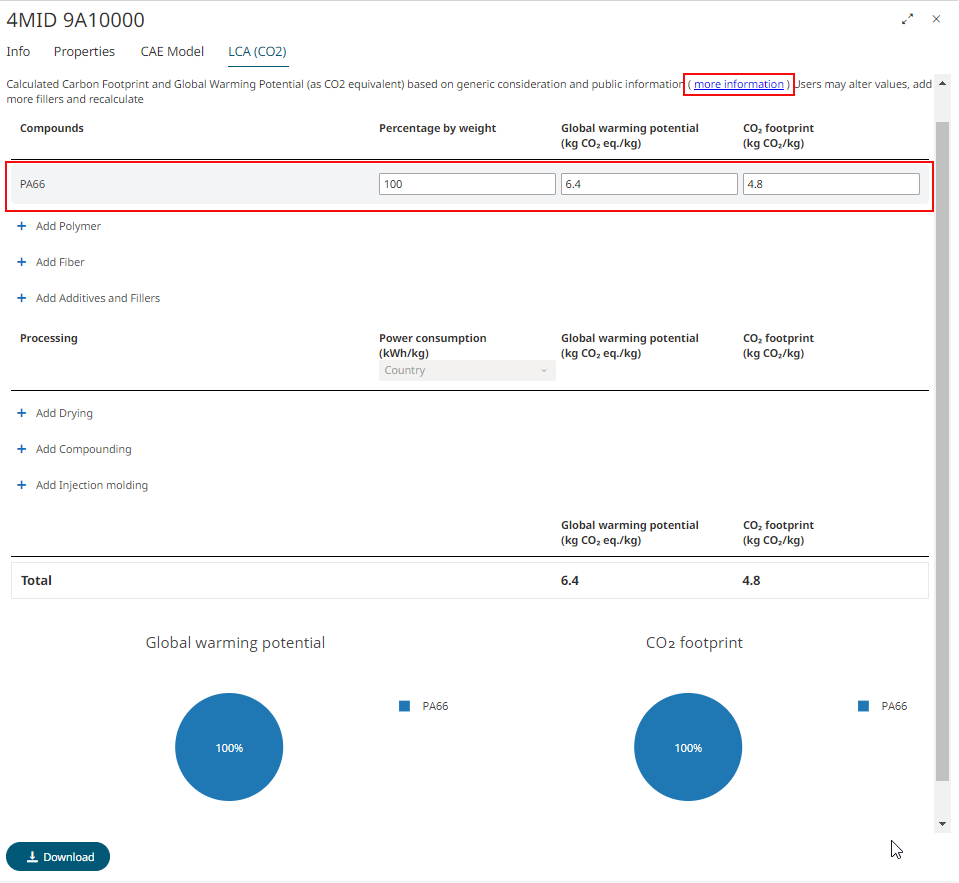
Figure 2. GWP and carbon footprint of a materialNote: To understand the assumptions based on which the system calculates the GWP and C02 footprint values, click the more information link. -
To customize a material, add different types of compounds such as Polymer,
Fiber, and any Additive or Filler based materials. In this example, I choose
Glass fiber as an additional compound.
The generic data of GWP and CO2 footprint for the additional compound material is displayed.
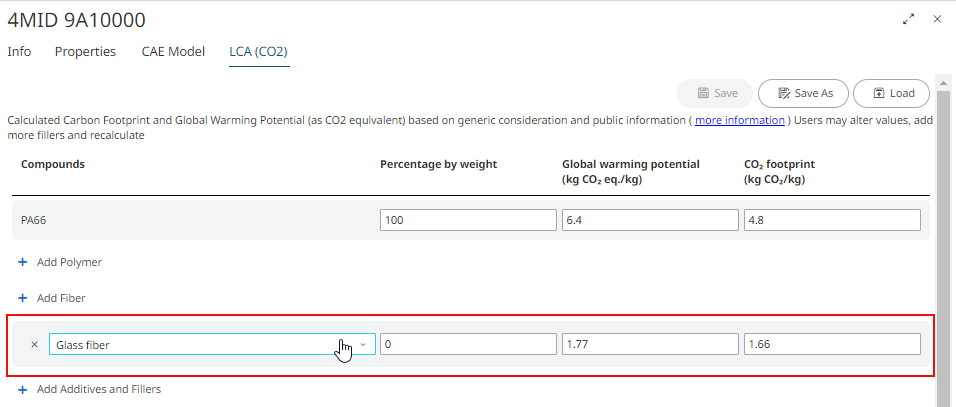
Figure 3. Selecting a Compound as Glass Fiber -
Specify the percentage of the material in the compound.
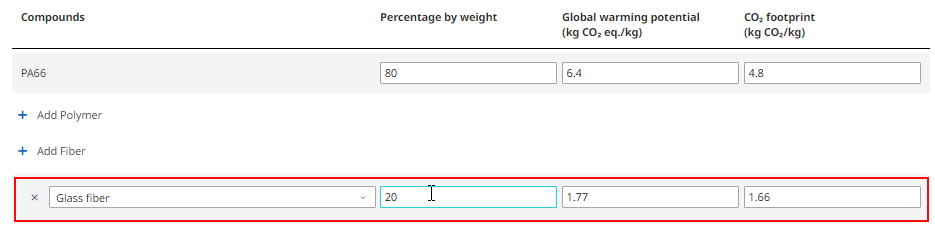
Figure 4. Specify the Glass Fiber ratio in the compound -
Add a Processing type for producing the new material
from the selected compounds. I select Add Drying
processing.
The power consumption value is displayed.
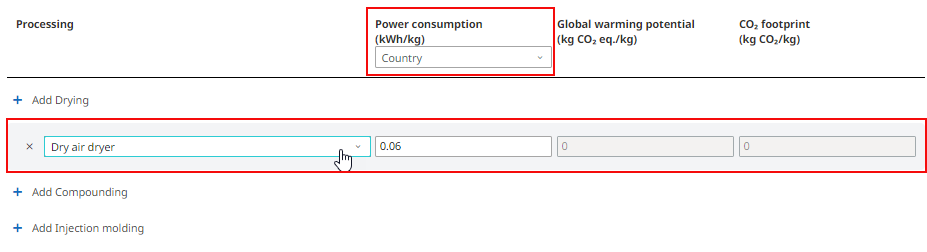
Figure 5. Add Processing TypesNote: The Country field is enabled to select. -
Change the Country name from the list.
The generic data of GWP and CO2 footprint for the selected country is displayed.
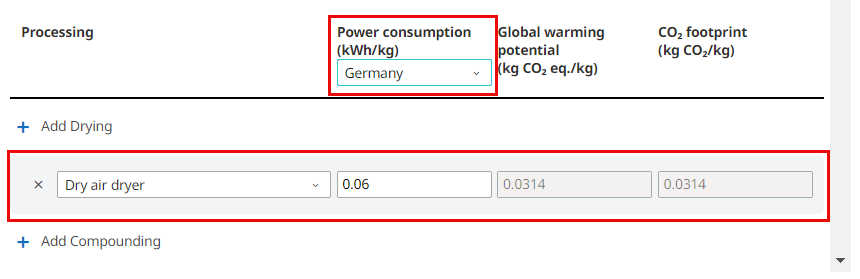
Figure 6. Power Consumption by CountryNote: Add more processing types for understanding the amount of GWP and CO2 footprint effect of the material in the compound. -
Scroll down to view the pie chart of GWP and CO2 footprint
values.
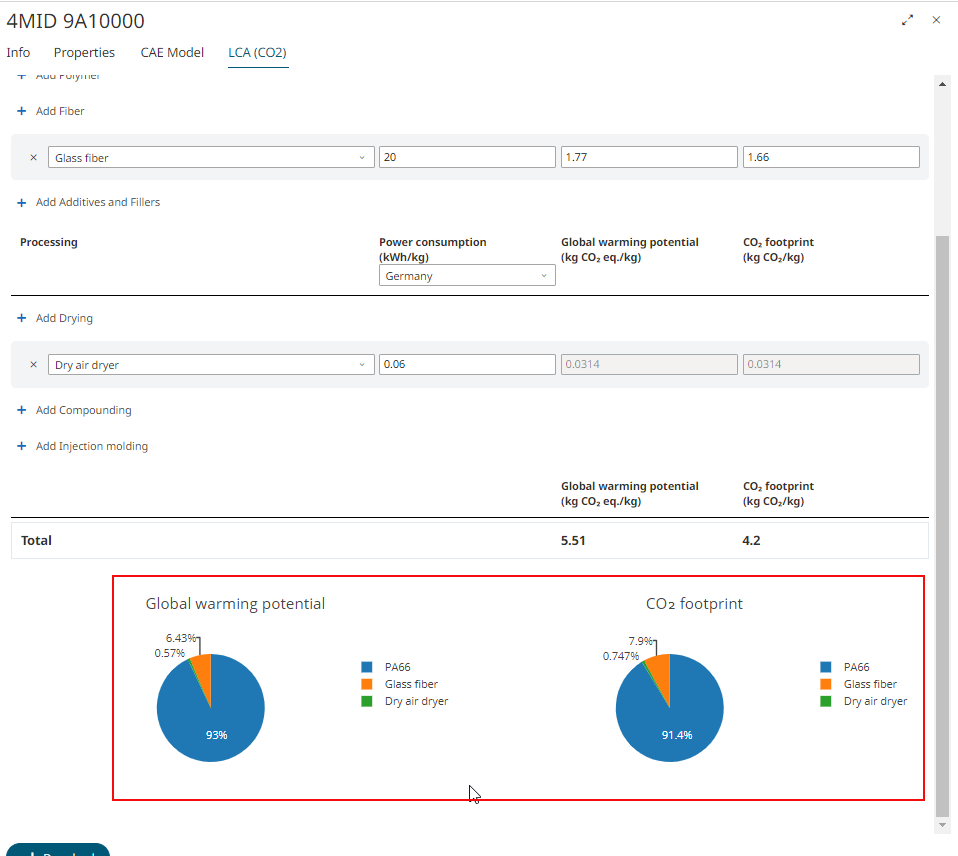
Figure 7. GWP and CO2 footprint values in a Pie Chart