View Long Term Heat Aging Plots
Understand a material's thermal endurance and Arrhenius parameters by visualizing Long Term Heat Aging (LTHA) plots.
-
Select the LTHA Stress at Break plot from the list.
The selected plot is displayed.
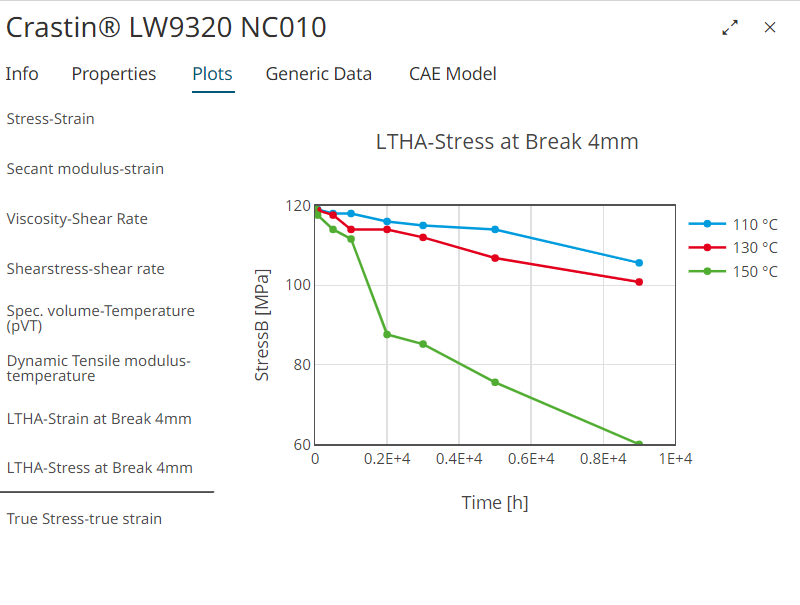
Figure 1. LTHA Break at Stress Plot -
Click
 on the plot options menu.
Tip: Hover over the plot area to view the plot options.The LTHA Stress at Break and Thermal Endurance plots are displayed.
on the plot options menu.
Tip: Hover over the plot area to view the plot options.The LTHA Stress at Break and Thermal Endurance plots are displayed.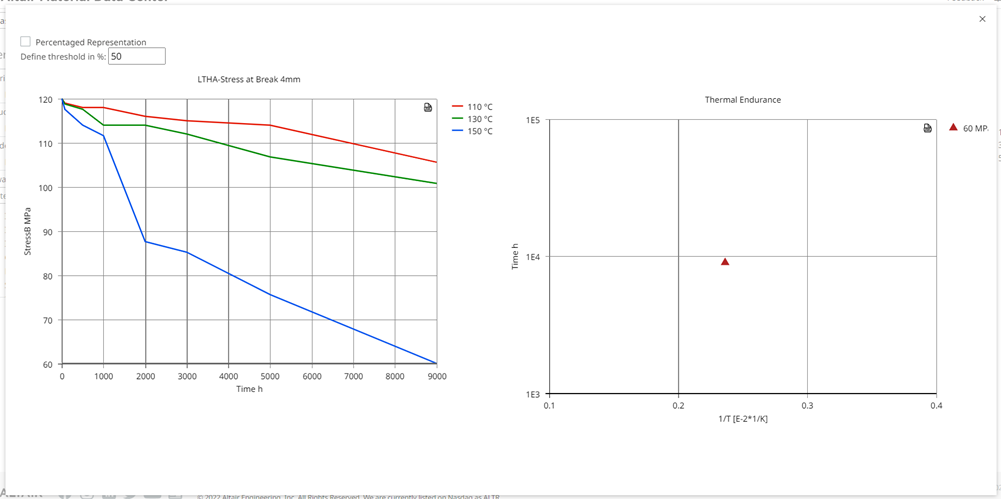
Figure 2. LTHA Stress at Break and Thermal Endurance Plots -
To analyze the material data, enter a threshold value in Define
threshold in %.
The Thermal Endurance points are displayed. If a minimum of three thermal endurance points are intersected then a regression line is drawn automatically and it calculates the Arrhenius Parameter for a material.
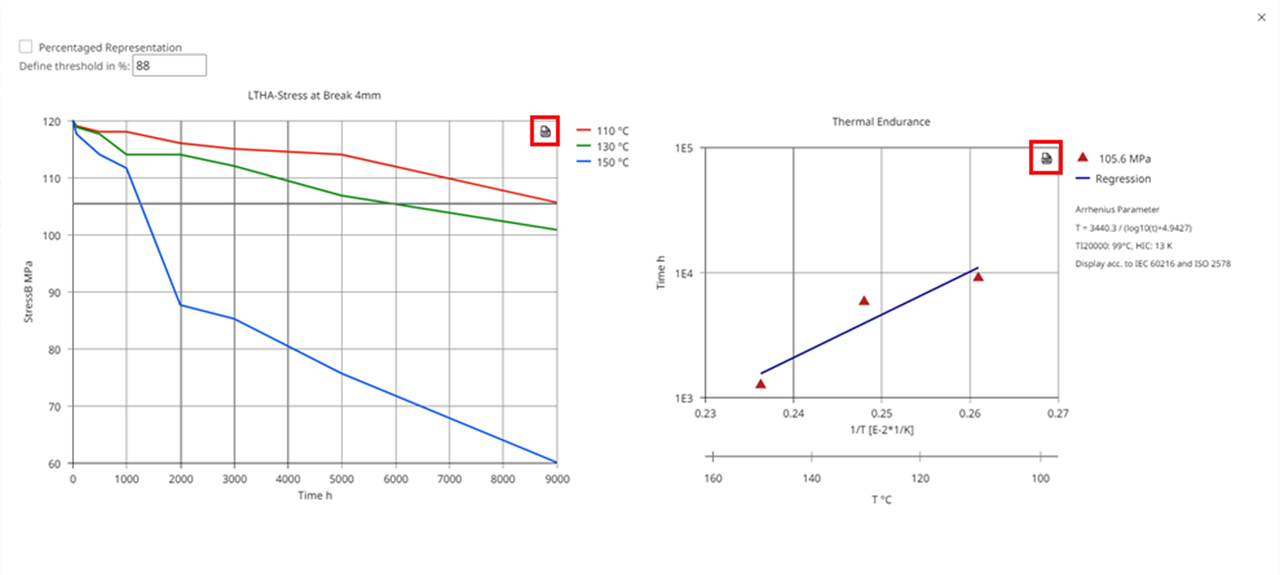
Figure 3. Define Threshold in %Click
 to
export the chart as a PDF document.
to
export the chart as a PDF document. -
Select the Percentaged Representation check box.
The thermal endurance result is calculated in percentage with the 100% stress applied to the material at different temparatures.
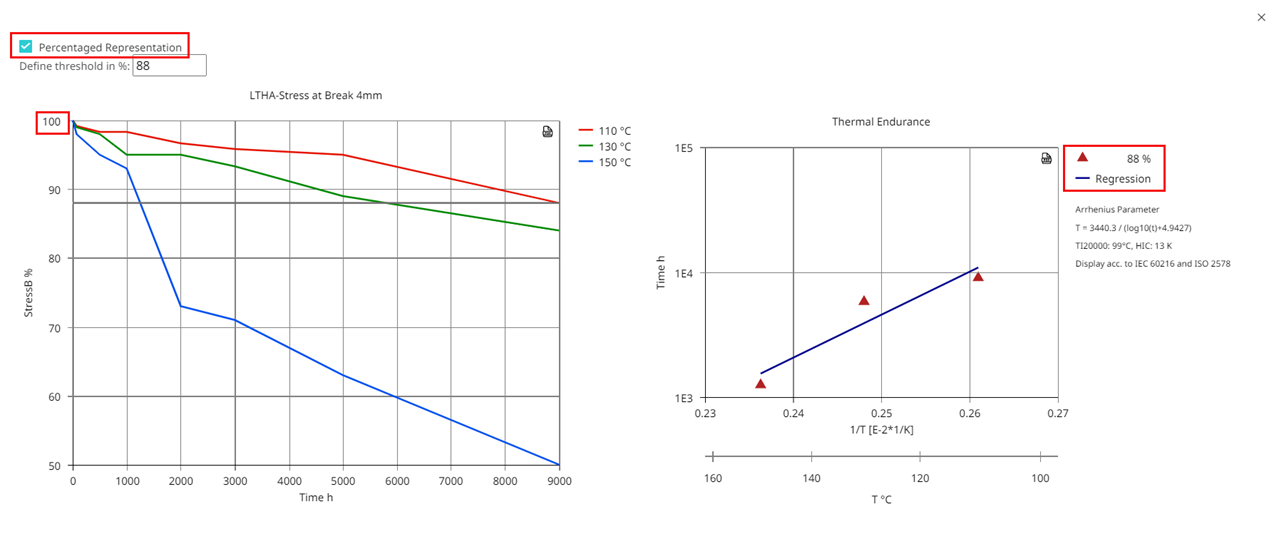
Figure 4. Thermal Endurance Result in Percentage