Prepare Data
Each file in the list can be edited individually.
-
Normalize the x axis to 1 (1 represents 100% strain).
-
Define Young’s modulus manually or automatically.
To normalize the abscissa (x-axis) in a raw data file, select the file, set a scale value for the xvalues, and then hit Scale to multiply the axis values by that factor. For example, if the X values of the raw data are in percent [%], set the X value to 0.01 and then press Scale.
The raw data curves can be shifted horizontally along the x-axis if the starting point is not close to the origin (x-axis zero). Click the Shift key to move the curve to the defined value.
Negative values are also allowed, and in this case the shift is in the opposite (horizontal) direction.
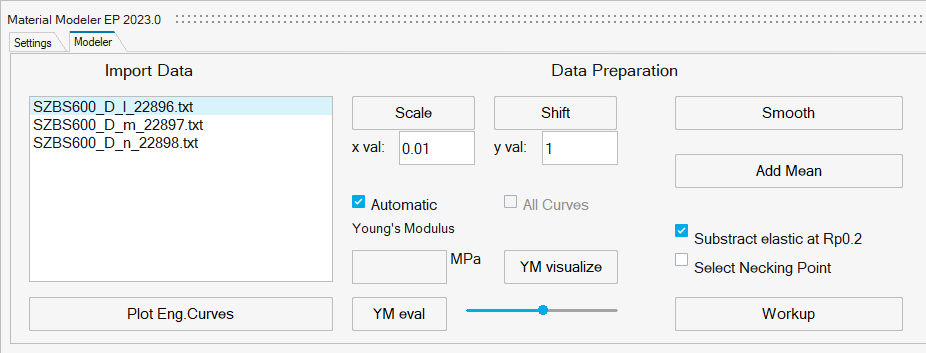
Figure 1. Normalization and horizontal movement of the data curvesThere are two ways to define Young’s modulus:
-
Select All Curves to set this value for all imported
files/curves.
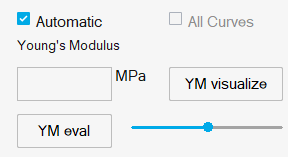
Figure 2. Automatic or manual definition of Young’s ModulusSmooth noisy or oscillating data using the Smooth button. For repetitive curves, you can use the Add Mean button to derive a mean curve and select the curves for averaging.Check or uncheck the box to subtract the elastic part of the 0.2% strain if you want to consider the Rp0.2 value (useful for metals), which is often provided by material manufacturers. Some materials are characterized by early softening with a very long plasticizing strain.Note: It is necessary to define the necking point manually as it is useful for plastics and high-strength steel. -
Select Necking Point and define this point for each
selected curve.
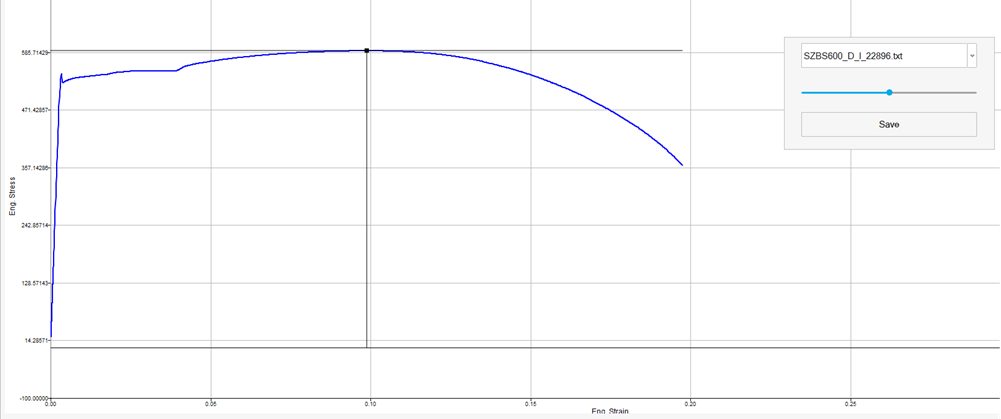
Figure 3. Manual selection of the Necking Point