stairs
Generate a stair step plot.
Syntax
stairs(y)
stairs(x, y)
stairs(..., fmt)
stairs(..., property, value, ...)
stairs(hAxes, ...)
h = stairs(...)
[xout, yout] = stairs(...)
Inputs
- x, y
- Input values. If x is not given then the indices of y are used.
- fmt
- Formatting string of the curve.
- property
- Any valid property for a line graphic object.
- value
- Value of the property.
- hAxes
- Handle of an existing axis object.
Outputs
- h
- Handle of the line graphics object.
- xout
- Generated x data.
- yout
- Generated y data.
Example 1
Simple stairs step plot.
figure;
h = stairs(1:10);
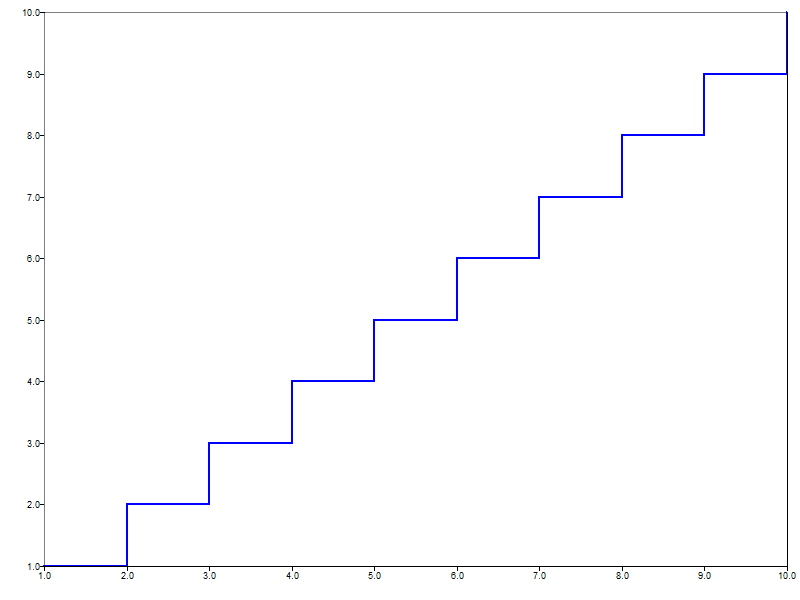
Figure 1. stairs figure 1
Example 2
Set x values and a line style.
figure;
h = stairs([1:2:10 11:14],  [1:5 4:-1:1], 'r--');
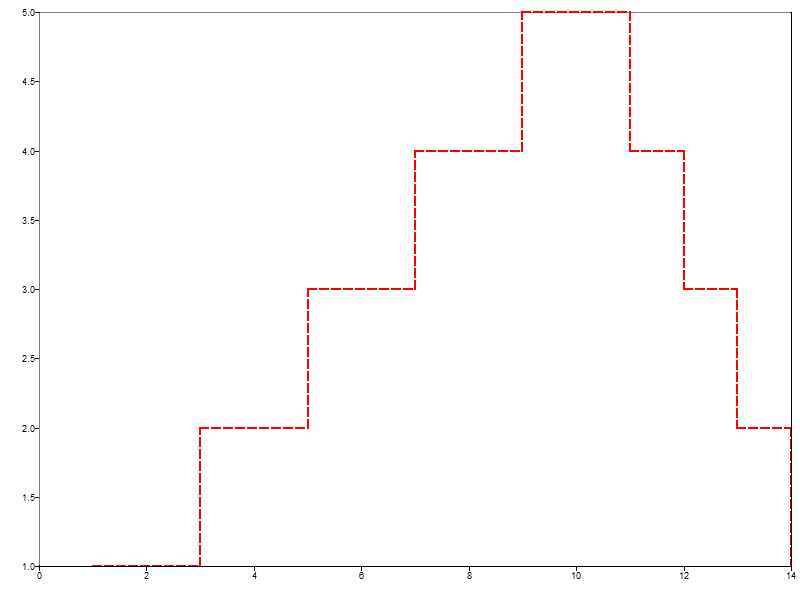
Figure 2. stairs figure 2
Example 3
X, y are matrices.
figure;
x = [1:10; 3:12; 5:14]';
y = ones(10,3).*[1:10]';
h = stairs(x, y);
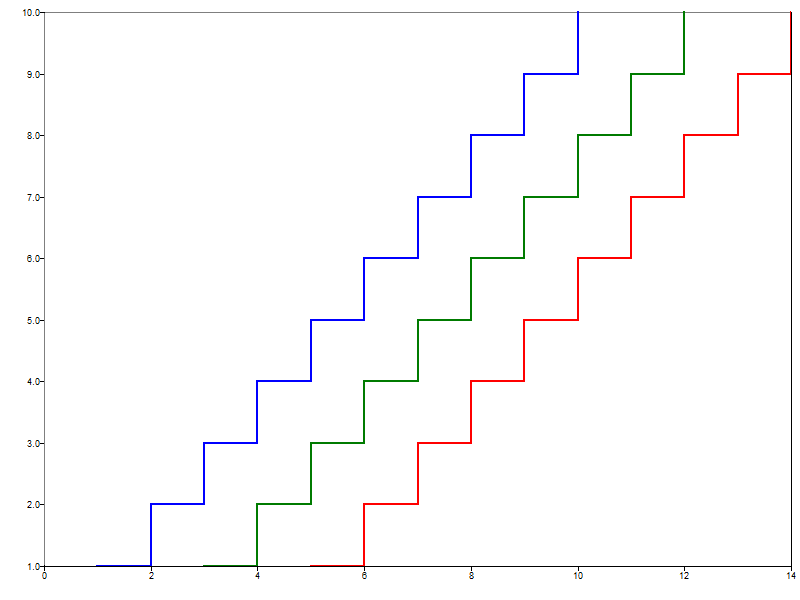
Figure 3. stairs figure 3
Example 4
Get x, y values without creating a plot.
[xout, yout] = stairs(1:2:20, 1:10);
Comments
If no output or one output argument is given then the stairs command will plot a line in the current axes. If an axes doesn't exist, then one will be created. If two output argumnets are given, then the generated x, y values will be returned and the plot will not be created.