spectrogram
Spectrogram.
Syntax
sp = spectrogram(x)
sp = spectrogram(x,fs)
sp = spectrogram(x,fs,window)
sp = spectrogram(x,fs,window,overlap)
sp = spectrogram(x,fs,window,overlap,nfft)
sp = spectrogram(x,fs,window,overlap,nfft)
sp = spectrogram(x,fs,window,overlap,nfft,range)
[sp,t,f] = spectrogram(...)
Inputs
- x
- The signal to be analyzed power spectrum content.
- window
- The window size, or the window column vector.
- overlap
- The number of overlapping points in adjacent windows.
- nfft
- The size of the fft.
- fs
- The sampling frequency.
- range
- The spectrum type. The options are as follows:
- 'onesided' (default)
- 'onesided_dB'
- 'twosided'
Outputs
- sp
- The spectogram power density output, with segments stored by column.
- t
- The vector of times corresponding to the start of each column of sp.
- f
- The vector of frequencies corresponding to each row of sp.
Example
spectrogram of a linear chirp signal.
f0 = 0;
f1 = 5;
T = 10;
c = (f1 - f0) / T;
t = [0:0.1:T-0.1];
x = sin(2 * pi * ((c/2)*t.^2 + f0*t));
spectrogram(x, 10, 20, 14, 32, 'onesided');
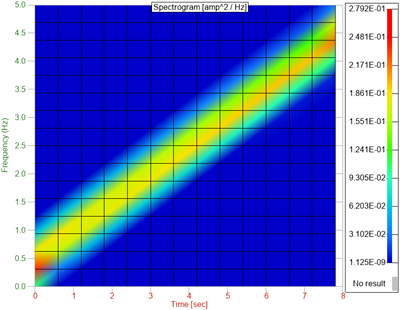
Figure 1. spectrogram figure 1
Comments
Default values are assigned to arguments with a [] input.
The function produces power spectral density values with no compensation for the window bias. It may be useful to normalize sp by sum(win.^2), where win is the window vector.
The 'onesided' and 'onesided_dB'outputs have a length of nfft/2+1 if nfft is even, or (nfft+1)/2 if nfft is odd.
It is often recommended to remove the trend line prior to calling spectrogram. The function does not automatically call detrend.