hist3
Creates a 3d histogram in an axis.
Syntax
hist3(z)
hist3(z, [XBins YBins])
hist3(z, 'nbins', [XBins YBins])
hist3(z, 'ctrs', {XBinsCenter, YBinsCenter})
hist3(z, 'edges', {XBinsEdges, YBinsEdges})
hist3(..., property, value, ...)
hist3(hAxes, …)
[nums, binCenters, h] = hist3(…)
Inputs
- z
- Values to create the histogram arranged in a Mx2 matrix. Rows with NaN values will be ignored.
- XBins, YBins
- Number of bins on each axis. Default value is 10.
- XBinsCenter, YBinsCenter
- Vector containing the center of the each bin.
- XBinsEdges, YBinsEdges
- Vector containing the edges of each bin. A z value is assigned to bin i only if XBinsEdges[i] <= value < XBinsEdges[i+1] and YBinsEdges[i] <= value < YBinsEdges[i+1]. Values less than the first edge value or greater than the last edge value will be ignored. The last bin contains values equal to the last edge.
- property
- Properties that control the appearance or behavior of the graphics object.
- value
- Value of the properties.
- hAxes
- Axis handle.
Outputs
- nums
- A matrix of the numbers of elements in each bin.
- binCenters
- An cell array contaning the center of bins on each axis.
- h
- Handle of the bar3 graphics object.
Examples
Simple hist3 example:
clf;
z = [6 4 1 5 6 6 4 1 7 1 5;3 1 4 6 3 3 3 4 5 2 6]';
hist3(z);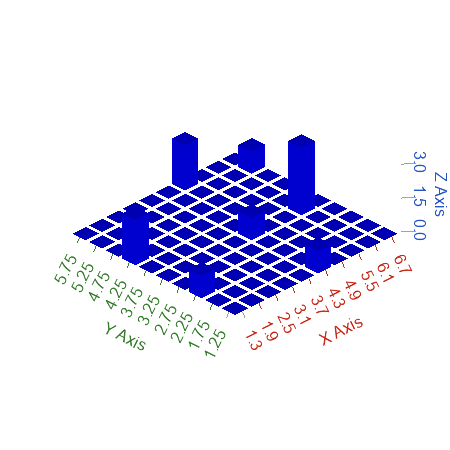
Figure 1. 3d histogram with 10 (default) bins
Set the number of bins:
clf;
z = [6 4 1 5 6 6 4 1 7 1 5;3 1 4 6 3 3 3 4 5 2 6]';
hist3(z, [5, 5]);
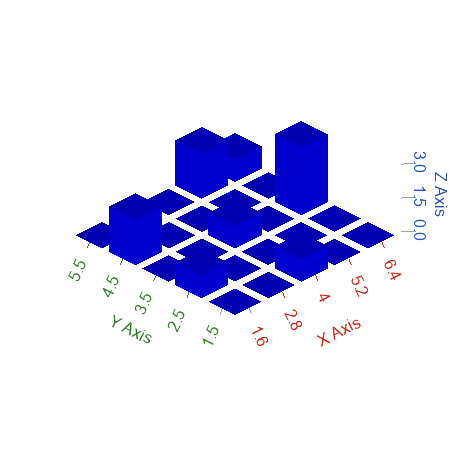
Figure 2. 3d histogram with user-defined number of bins
Set the center of bins:
clf;
z = [6 4 1 5 6 6 4 1 7 1 5;3 1 4 6 3 3 3 4 5 2 6]';
hist3(z, 'ctrs', {[1 4 5 6], [2 3 4]});
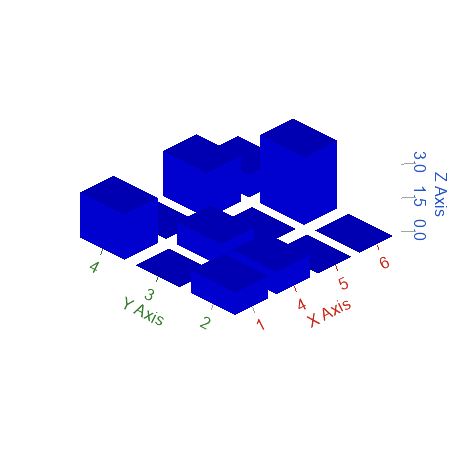
Figure 3. 3d histogram with user-defined center of bins
Set the edges of bins:
clf;
z = [6 4 1 5 6 6 4 1 7 1 5;3 1 4 6 3 3 3 4 5 2 6]';
hist3(z, 'edges', {[2 4 6 8], [1 3 5 7]});
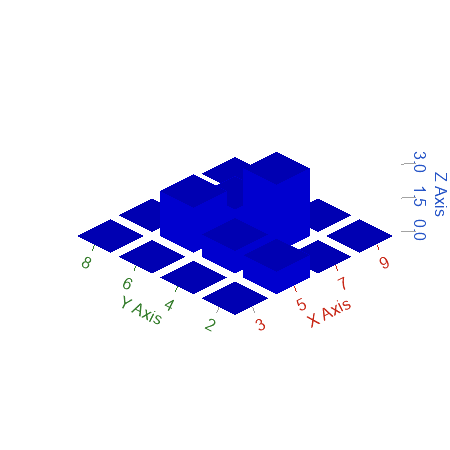
Figure 4. 3d histogram with user-defined edges of bins
Get the number of elements in each bin and the center of bins without creating the plot:
clf;
z = [6 4 1 5 6 6 4 1 7 1 5;3 1 4 6 3 3 3 4 5 2 6]';
[nums, centerOfBins] = hist3(z, 'edges', {[2 4 6 8], [1 3 5 7]})
nums = [Matrix] 4 x 4
0  0  0  0
1  1  2  0
0  3  1  0
0  0  0  0

centerOfBins =
{
  [1,1] [Matrix] 1 x 4
  3  5  7  9
  [1,2] [Matrix] 1 x 4
  2  4  6  8
}
Set a 3d bar plot property and get the 3d bar plot handle:
clf;
z = [6 4 1 5 6 6 4 1 7 1 5;3 1 4 6 3 3 3 4 5 2 6]';
[nums, centerOfBins, h] = hist3(z, 'ctrs', {[1 4 5 6], [2 3 4]}, 'color', 'g');
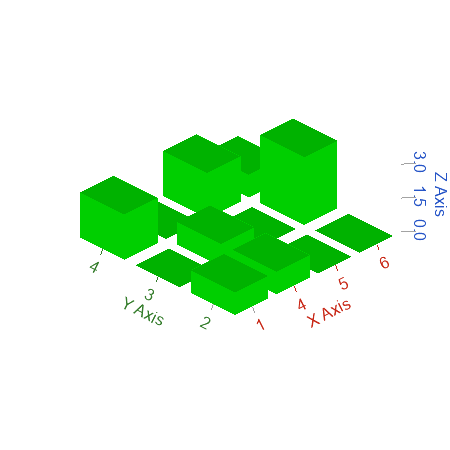
Figure 5. Set the color property
Comments
If there is no axis, one will be created first. If the first argument of hist3 is an axes handle, the histogram will be created in that axes.
If the number of output arguments is 1 or 2, hist3 will not create a histogram, but rather calculate the number of elements in each bin(nums) and/or centers of each bin(binCenters).