bar3
Creates 3d bars on an axis and returns the handles of the bars.
Syntax
h = bar3(z)
h = bar3(z, color)
h = bar3(z, 'rowhandle')
h = bar3(z, color, 'rowhandle')
h = bar3(hAxes, ...)
Inputs
- z
- Range of the x, y, and z axes..
- color
- Color of the bar plot.
- 'rowhandle'
- If the keyword 'rowhandle' is given then the bar3 command will return a handle for each row of the bar plot.
- hAxes
- Axis handle. .
Outputs
- h
- Handle of the surface graphics object.
Examples
Simple bar3 example:
bar3(rand(5,3));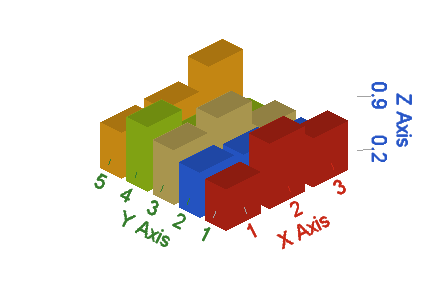
Figure 1. Bar3 plot
Use the 'rowhandle' keyword to obtain a handle for each bar row:
clf;
h = bar3(rand(5,2),'rowhandle')
set(h(2), 'color',[115 194 255]);
set(h(2), 'zdata',[1 1]);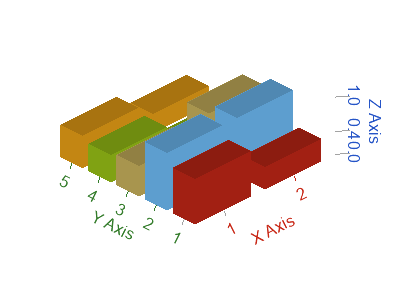
Figure 2. Obtain a handle for each bar row
Comments
If there is no axis, one will be created. If the first argument of bar3 is an axis handle, bars will be created on that axis.