colorbar
Turns the axes colorbar on/off. Get and set the colorbar's minimum and maximum values.
Syntax
h = colorbar()
h = colorbar(hAxes)
h = colorbar('on')
h = colorbar('off')
h = colorbar(hAxes, 'on')
h = colorbar(hAxes, 'off')
h = colorbar([c_lo c_hi])
h = colorbar(hAxes, [c_lo c_hi])
[c_lo c_hi] = colorbar()
[c_lo c_hi] = colorbar(hAxes)
Inputs
- hAxes
- Handle of the axes.
- on/off
- Determines if the colorbar is visible or not.
- c_lo, c_hi
- Lowest and highest ranges.
Outputs
- h
- Handle of the colorbar object.
- c_lo, c_hi
- Current range of the colorbar.
Example
Simple colorbar
example:
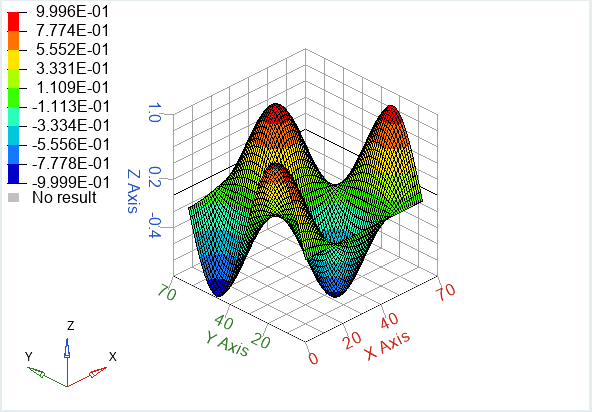 Figure 1.
cla;
x=[0:0.1:2*pi];
y=x;
z=sin(x')*cos(y);
contour3(z);
colorbar();Set colorbar min/max
values:
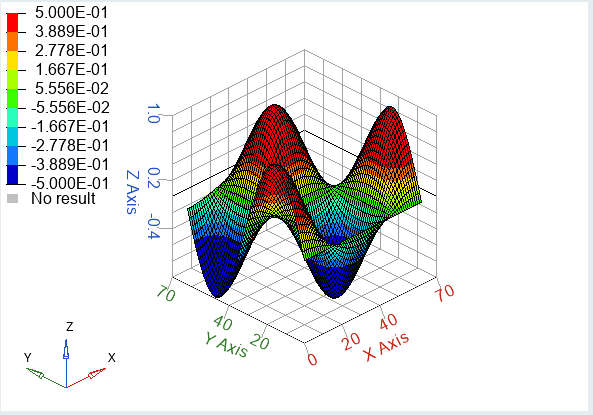 Figure 2.
cla;
x=[0:0.1:2*pi];
y=x;
z=sin(x')*cos(y);
contour3(z);
colorbar([-0.5 0.5]);Comments
colorbar is available in the contour, contour3, and imagesc plots.
c_lo, c_hi specify the values assigned to the first and last color in the colormap. Data values lower or higher than c_lo/c_hi will be assigned the lowest/highest color of the colormap, respectively.