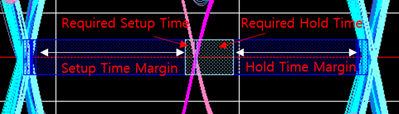
Data Line Analysis
Analyze interconnect network of data byte group nets of DDR BUS in time domain to obtain the eye diagrams and transient waveforms which are different views of the signal delay and distortion.
When performing an Automatic DDR Bus Simulation, please consider the following :
- Net Topology Review: Please review of the net topology for Data, Address, Command, and Control nets in advance.
- Power Setting: Please set power as 0V.
- Floating Nets: Please verify that there are no floating nets.
Creating a network analysis model starts with selecting data strobe net and data byte net from the net listing. The net name is initially assigned to the model name which can be changed by users. To analysis read and write cycle, CPU component must be selected for write cycle analysis and MEMORY component must be selected for read cycle analysis using Active Driver Pin.
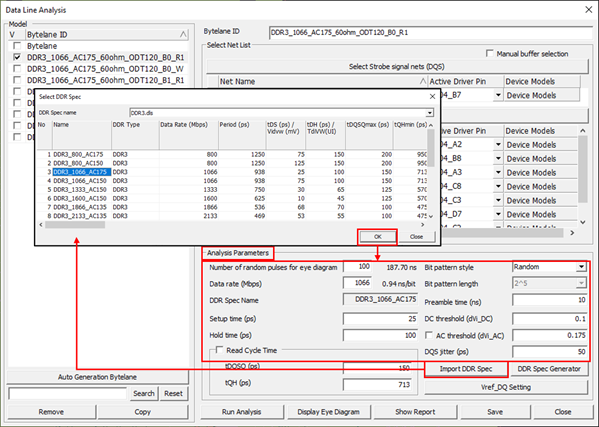
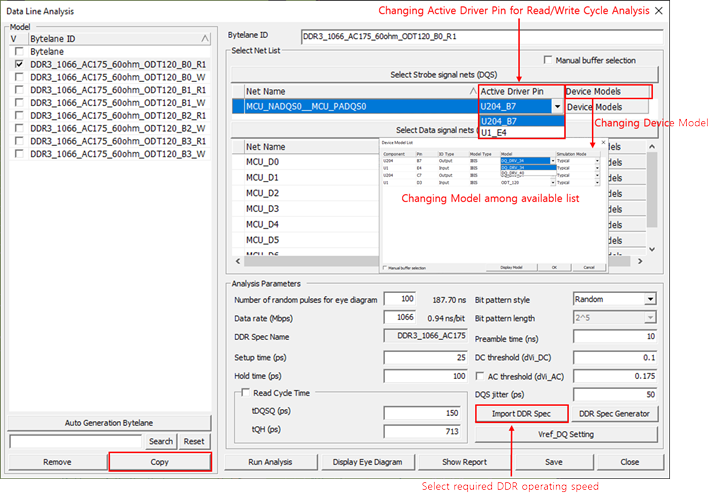
The analysis is performed upon selecting Run Analysis menu.
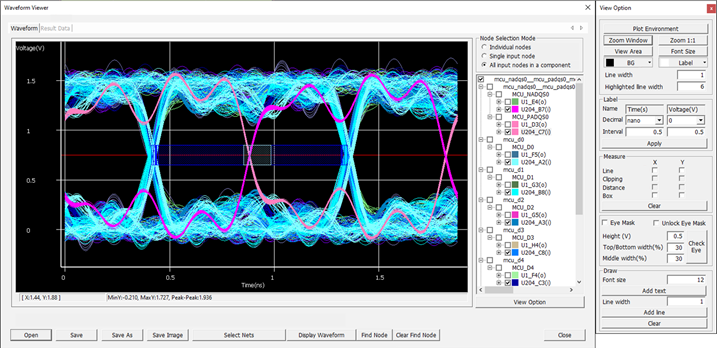
Eye Diagram analysis is running transient circuit simulation on the network model to obtain eye diagrams at the input nodes. An eye diagram or eye pattern is obtained from overlapping multiple waveforms at the receiver node of a net generated by randomly selected high/low states of the input signals for the selected net and adjacent nets. The coupling effects from the adjacent nets are reflected in the waveforms. Prior to running analysis, you can change the analysis control parameters such as the number of random pulses and bit pattern style.
The analysis results can be listed in a table form by clicking Show Report tab. They can be also shown in MS Excel.
The menu enables you to analyze data byte group nets in a one operation step.
- Individual nodes - This mode is used when a user wants to view one waveform
each for address or data lines, excluding the clock signal (Reference). For
example, the following are the example of viewing each of the five A0 lines separately.
Figure 5. 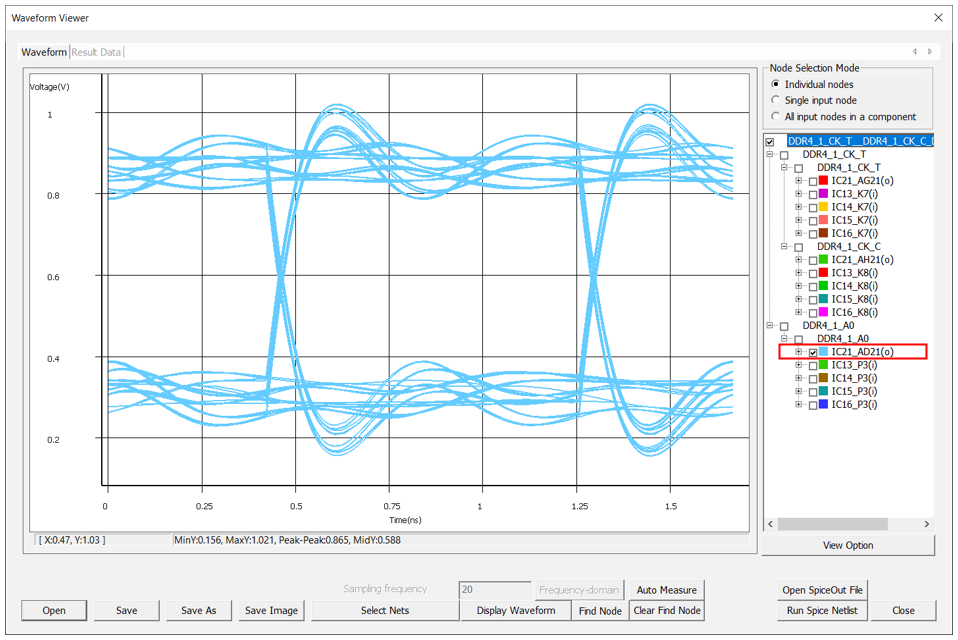
Figure 6. 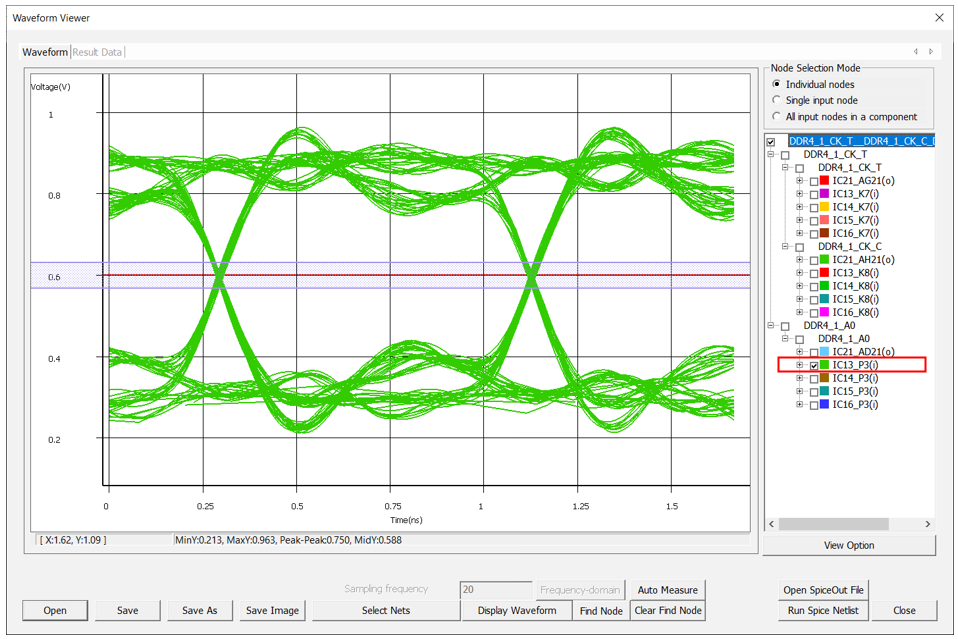
Figure 7. 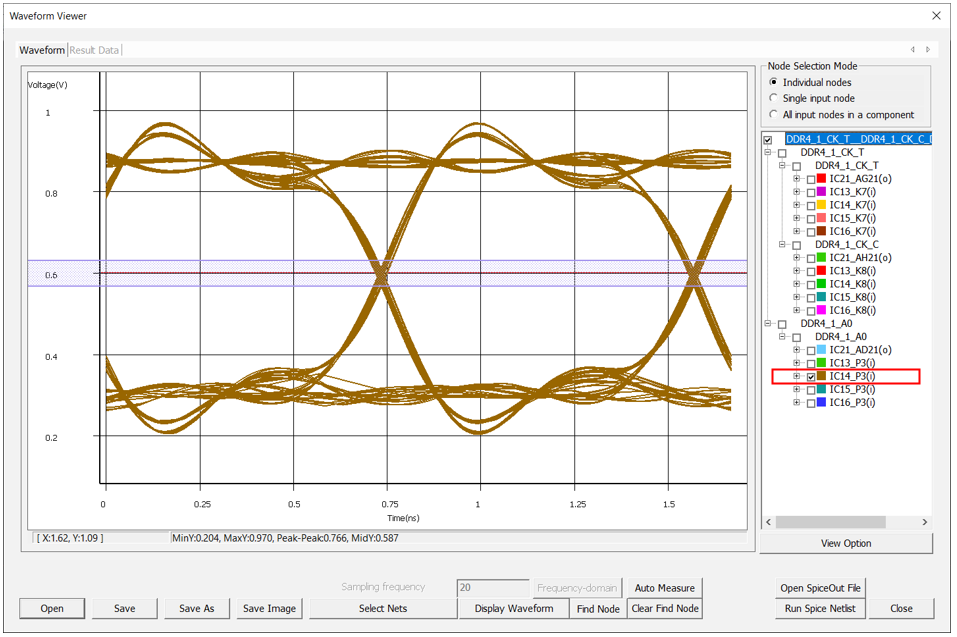
Figure 8. 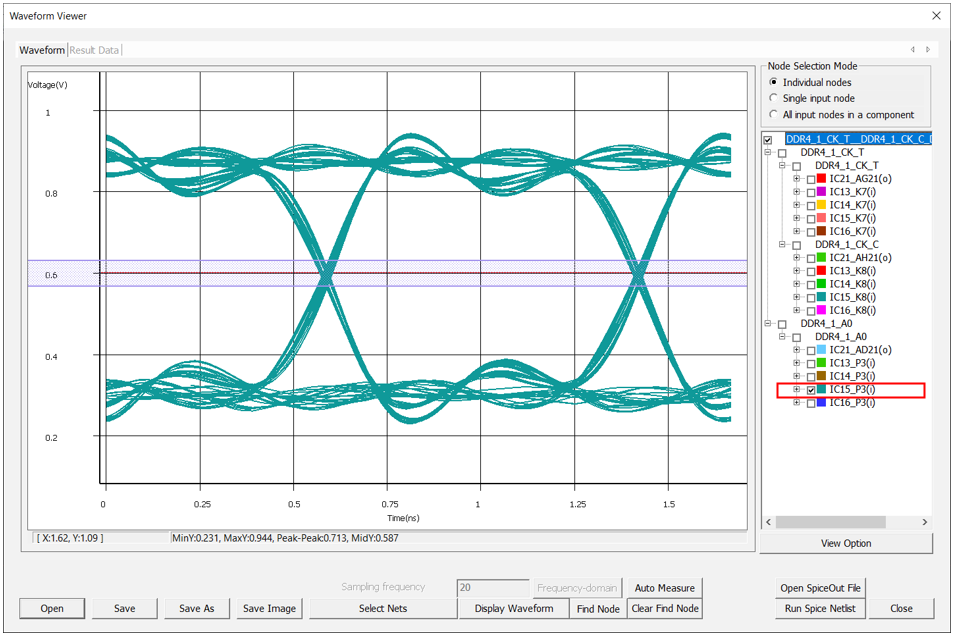
Figure 9. 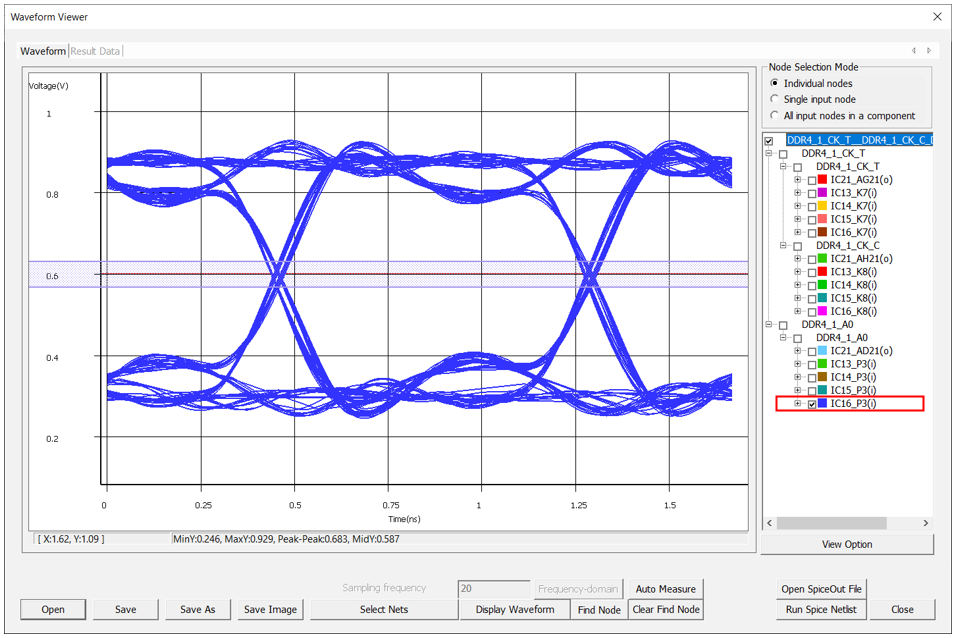
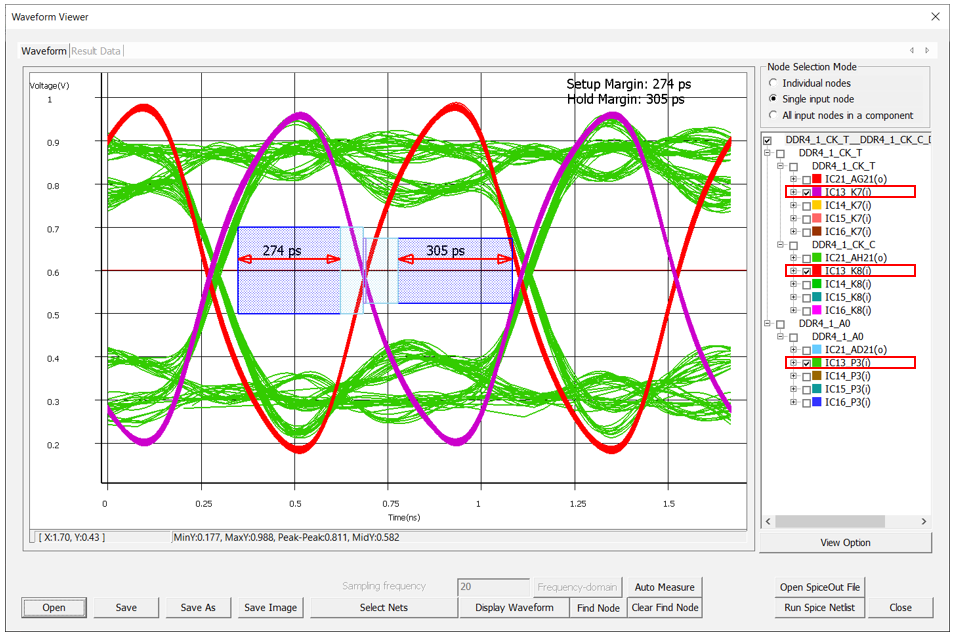
- Single input node - This mode is used when a user wants to view only the
plus and minus pairs of the clock signal and it displays two waveforms.
Input nodes include IC13_K7(i), IC14_K7(i), IC15_K7(i), IC16_K7(i) and
IC13_K8(i), IC14_K8(i), IC15_K8(i), and IC16_K8(i) that are DDR memory
side. For instance, clicking on IC14_K7(i) of the Clock automatically
selects IC14_K8(i) as below. They are a pair.
Figure 10. 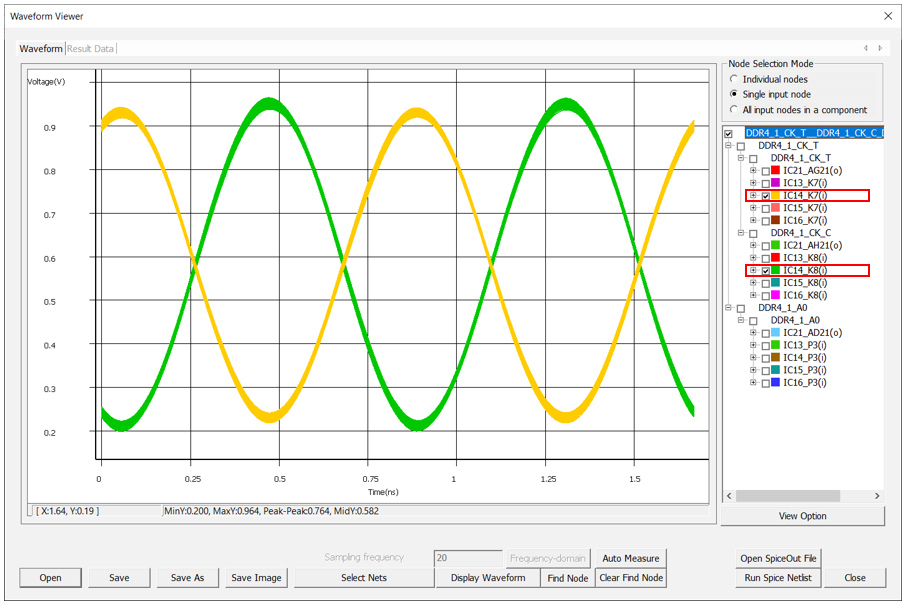
- All input nodes in a component - This mode displays both the address and the
plus/minus pairs of the clock signal simultaneously showing three waveforms.
For example, clicking on IC13_P3(i) of the Address automatically selects
IC13_K7(i) and IC13_K8(i) of the clock. Selecting IC13_K7(i) of the Clock
will also automatically choose IC13_P3(i) of the Address and IC13_K8(i) of
the clock.
Figure 11.