View 3D Pattern
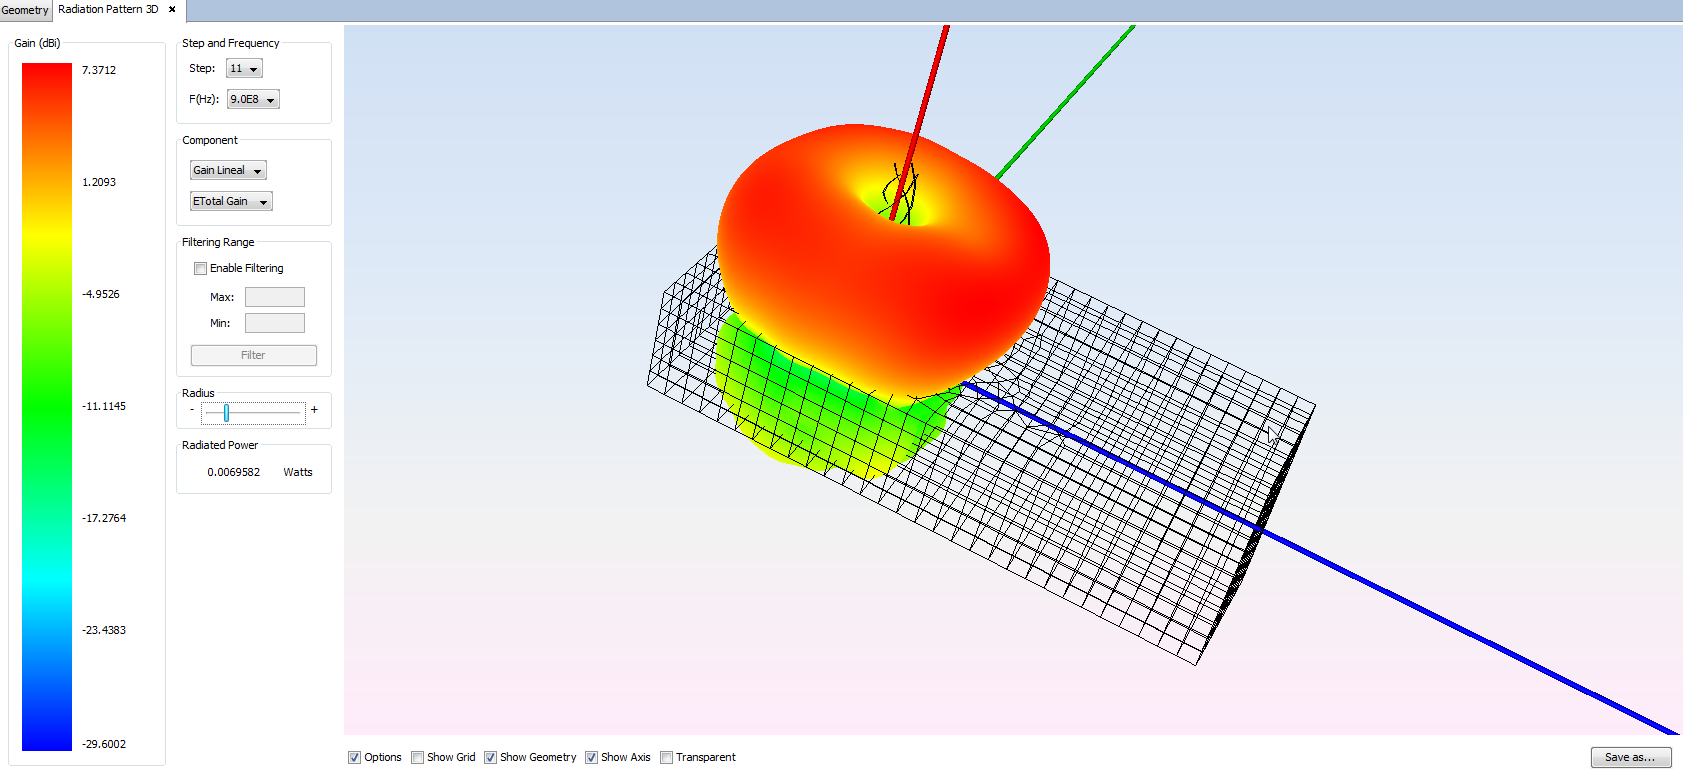
This option allows to visualize the full 3D pattern, classified by parametric and frequency steps. The next figure shows and example of 3D pattern:

The following elements are available within this panel:
- Left color legend it shows the magnitude and range of values of the represented results.
- Step and Frequency to select the results from the available
files to plot the diagram.
- Step specify the parametric step when a parametric simulation has been run.
- Frequency specify the desired frequency.
- Component The 3D diagram may be plotted by using different
polarizations and its components.
- Lineal: ETheta, EPhi, ETotal, Ex, Ey and Ex/Ey Total components.
- Circular RHCP, LHCP, Circular Total, and AxialRatio components.
- +/- 45 +45 and -45 components.
- 3rd Ludwig 3x Co-Polar, 3x Cross-Polar, 3y Co-Polar, and 3y Cross-Polar components.
- Gain (dBi): Theta Gain, Phi Gain, RHCP Gain, LHCP Gain and Total Gain components.
- Filtering Range Use this section to skip results that are
outside the desired range.
- Enable Filtering The filter only is applied when this check box is selected.
- Max To specify the maximum value of the range.
- Min To specify the minimum value of the range.
- Filter Click on this button to update the results filtering.
- Radius Use this slider to increase or decrease the size of the 3D pattern representation.
- Radiated Power Shows information about the effective radiated power (ERP), in watts.
- Bottom Options Below the 3D pattern diagram, the following
options are included:
- Options Disable this option to hide the left menus and visualize just the diagram.
- Show Grid Enable this option to show a line grid in the 3D pattern.
- Show Geometry Enable this option to visualize the geometry together the 3D pattern. Note that the 3D pattern is always represented in the origin of coordinates.
- Transparent Enable this option to add a transparency property to the visualized diagram.
- Save as To export the current representation as an image file.