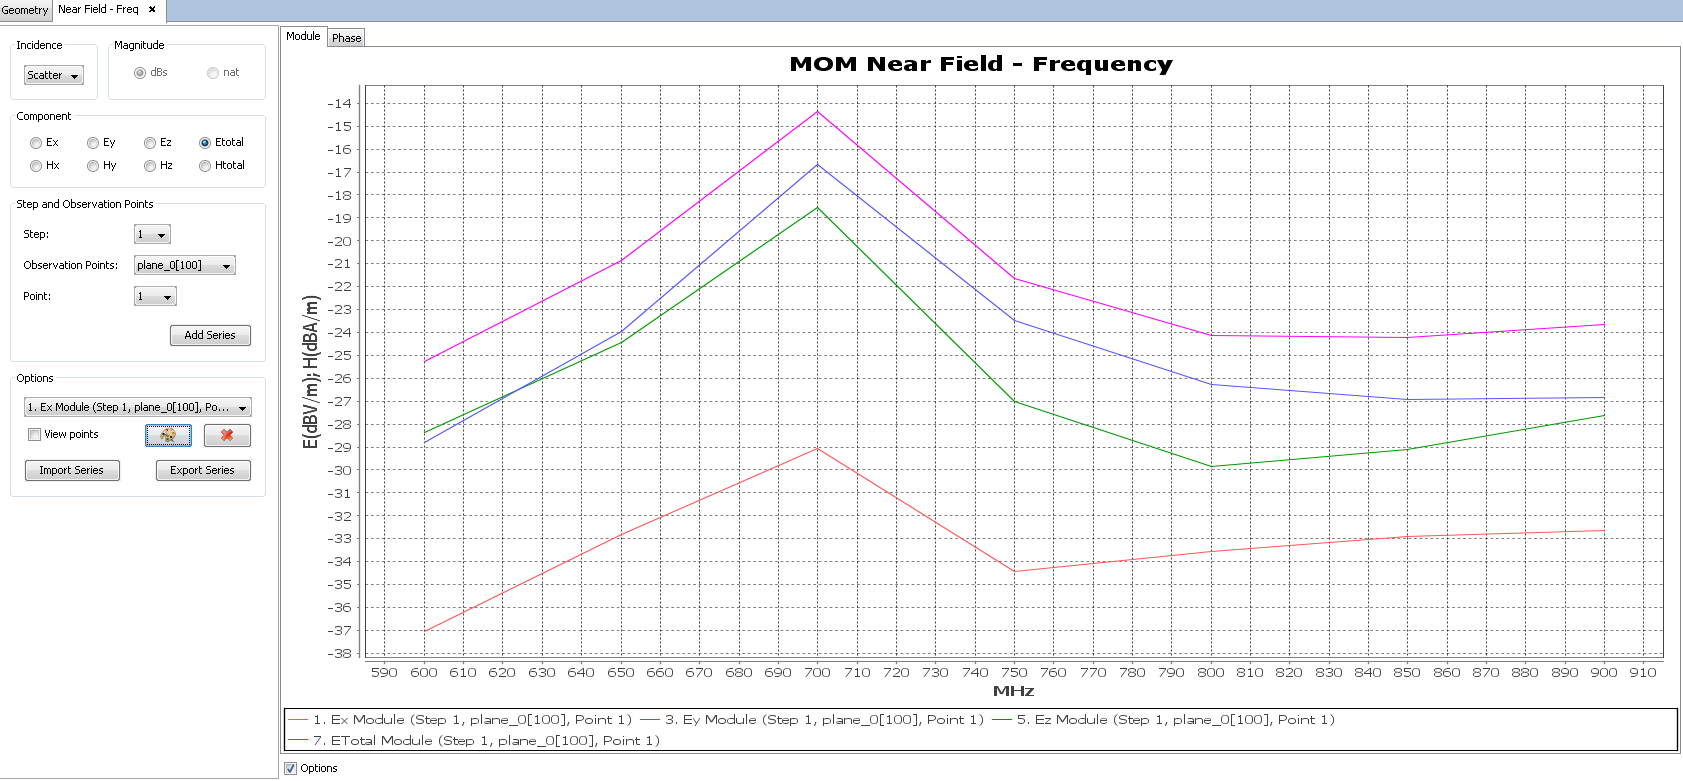
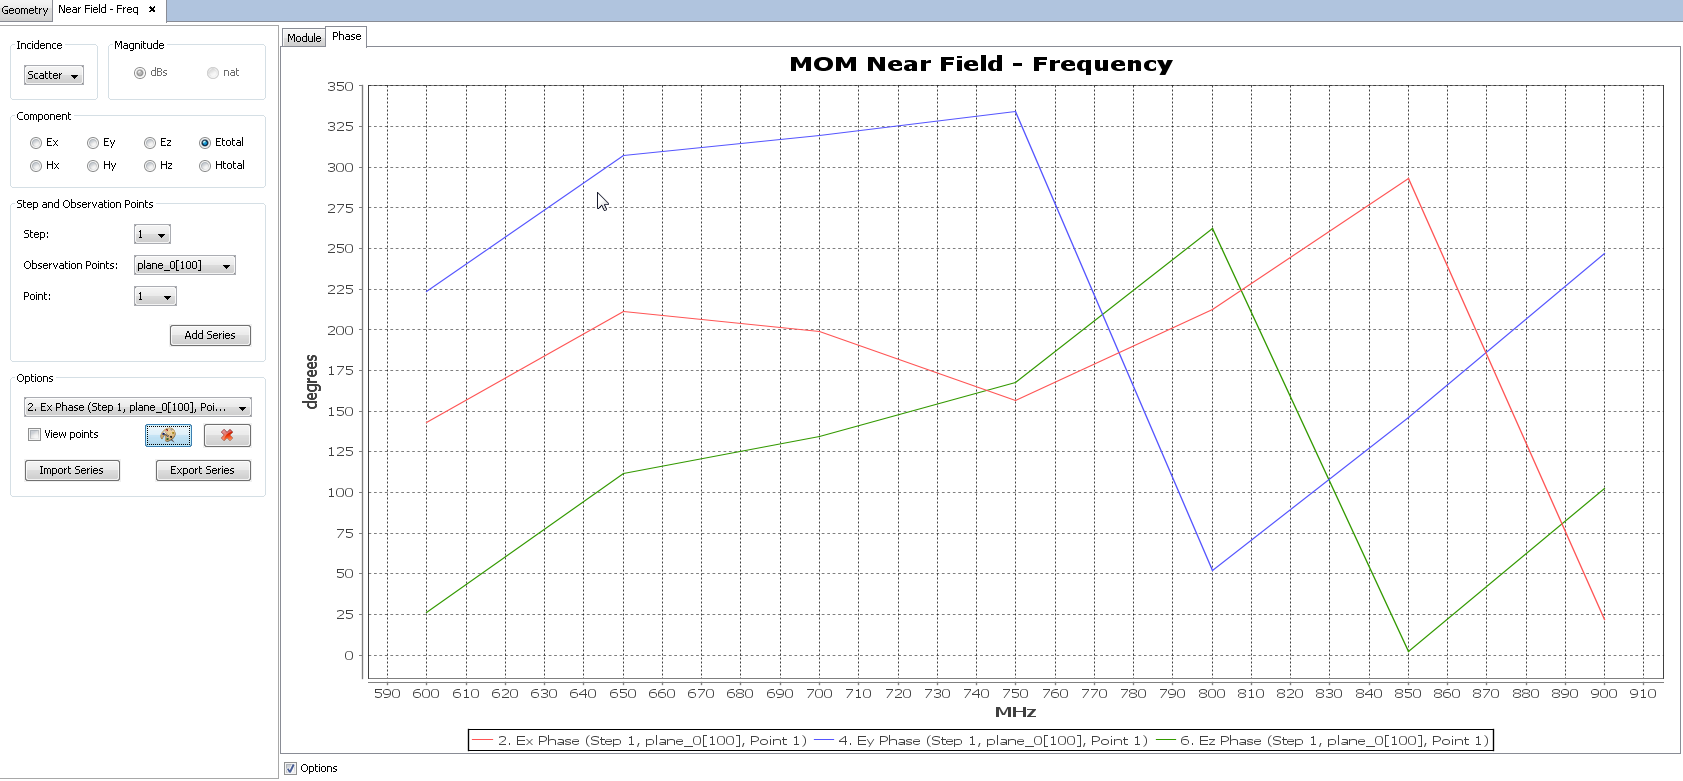
View Observation Points By Frequency
This option allow to compare the near field values in a given observation point according to the frequency. It is only useful if a Frequency Sweep has been run. Click on Show Results - Near Field - View Observation Points By Frequency, and the next window will appear:

Within this window, the following options are available:
- Incidence The near field may be plotted by considering
different contributions on the observation points.
- Scatter Scattered field components.
- Direct Direct field components.
- Total Combination of the scattered field plus the direct field components.
- Magnitude The near field may be represented in natural or dBs
magnitudes.
- dBs The near field is represented in logarithmic scale, given in dB-Amperes per meter for magnetic field, or in dB-Volts per meter for electric field.
- nat The near field is represented in natural scale, given in Amperes per meter for magnetic field, or in Volts per meter for electric field.
- Component To specify the field component to plot. Only one
component may be selected:
- Ex Plot the X component of electric field.
- Ey Plot the Y component of electric field.
- Ez Plot the Z component of electric field.
- ETotal Plot the total electric field, which is the combination of the X, Y and Z components.
- Hx Plot the X component of magnetic field.
- Hy Plot the Y component of magnetic field.
- Hz Plot the Z component of magnetic field.
- HTotal Plot the total magnetic field, which is the combination of the X, Y and Z components.
- Step and Observation Points Select the observation points to
plot.
- Step To specify the step results files when a parametric simulation has been run.
- Observation points List with all the observation points entities defined. Select the desired ones to load the next list.
- Point Specify the index point within the observation entities selected above to compare its values along the frequency.
- Add series:Confirm the observation points to plot and add its curve.
- Options Having inserted several plots, the
Options section allow to edit the result curves:
- List of Series All the plotted field components are listed. Note that two options are included for every plot for most of components both the amplitude and the phase. However, ETotal and HTotal only represent the module.
- View points Enable this option to visualize the points where the field has been computed for every inserted plot.
- Change color This option allows to change the color of the selected curve in the above List of Series.
- Remove To delete the selected curve in the above List of Series.
- Import Series To add a new plot from an external file. The file must have ". txt" extension, and it must contain in every new line the point index and the values to be plotted.
- Export Series:To export the selected curve in the above Plot List in a ".txt" file, with the point index and the value of the plot in a new line.
- Options Disable this option to hide the left menu and visualize just the near field curves.
