
Workspace
The application workspace includes a combination of tools, browsers and palettes of predefined and programmable blocks to help you easily construct and simulate dynamical system models.
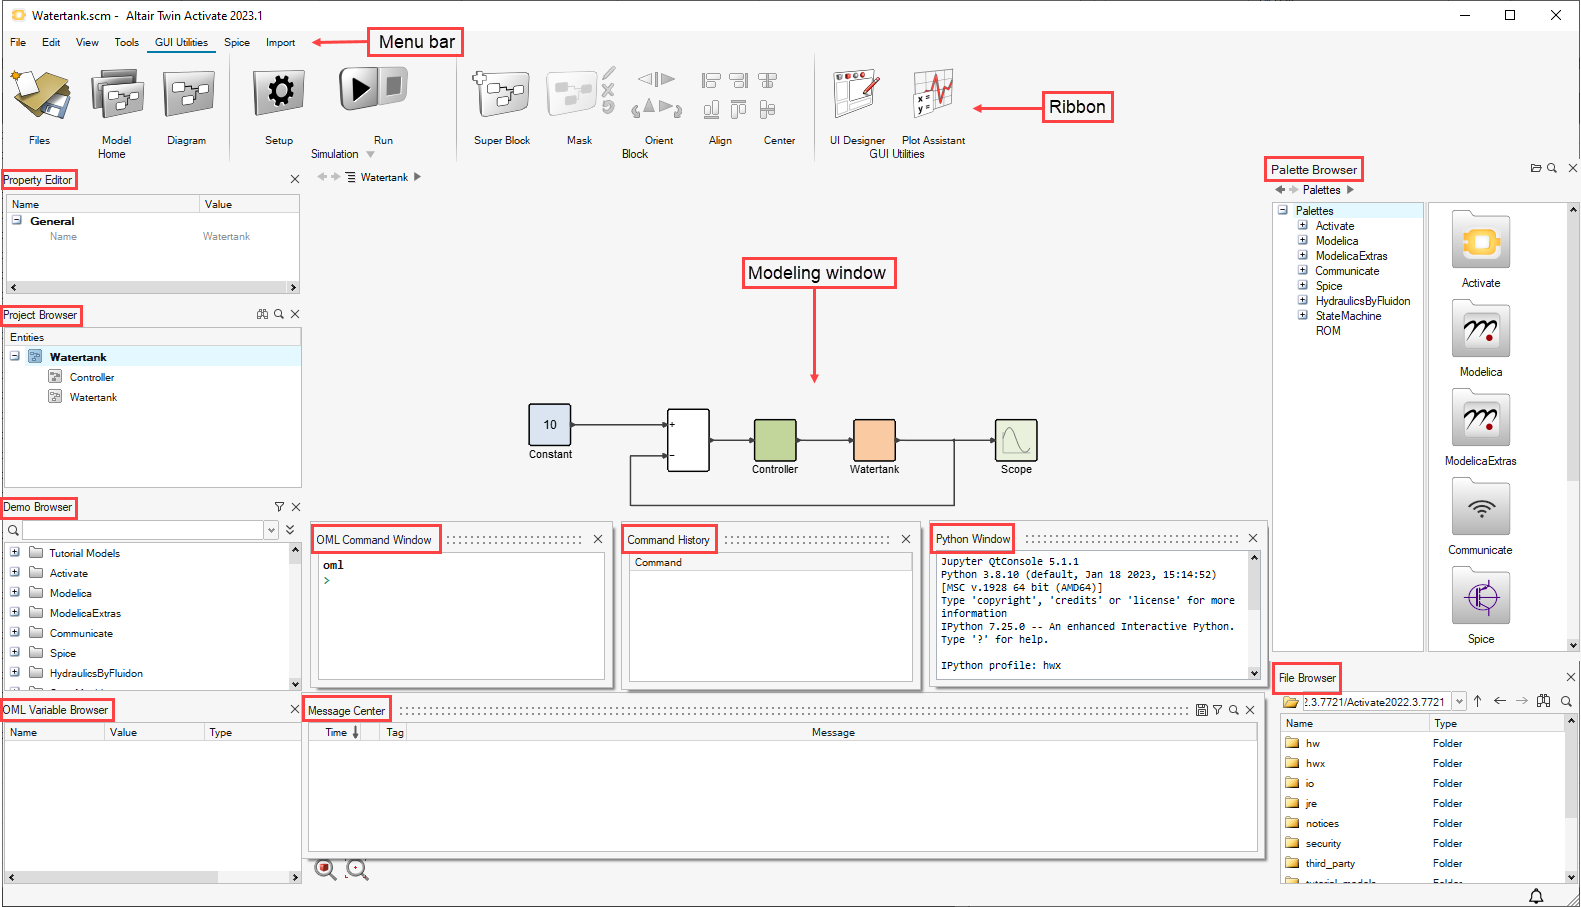
Menu Bar
The File, Edit, and View pull-down menus provide access to basic functions of the software. The Simulation, Modeling, Export, and Tools options open their respective ribbons.
File Menu
Provides access to standard file options as well as block libraries, screen captures, system preferences, help and tutorials.Edit Menu
Provides standard cut, copy and paste options.View Menu
Provides access to the Project Browser, File Browser, Variable Browser, Palette Browser, Property Editor, Command History and OML Command Window.Simulation
Provides access to the Simulation ribbon icons.Modeling
Provides access to the Modeling ribbon icons.Export
Provides access to the Export ribbon icons.Tools
Provides access to the Tools ribbon icons.Ribbon
The ribbon is the area of the GUI where you can access a variety of modeling and simulation tools. Some tools are arranged into tool groups. Hovering over a tool group highlights the individual tools in the group.
- Files
- The Files tool group provides standard options to create new, open existing and save files.
Simulation
Click the Simulation option in the Menu bar to open the simulation icons in the ribbon area.
- Model
- The Model tool lets you define initialization information for a model as well as archival information such as a model name, creation date and description.
- Diagram
- The Diagram tool lets you define a context for a diagram and view the parameters for a diagram.
- Simulation
- The Simulate tool group provides the options to set up, run, and stop the simulation of a diagram. You can also create results files and animations, and debug the simulation.
- Model check
- Compile the current model.
- Viewer
- View results file and animation.
Modeling
Click the Modeling option in the Menu bar to open the modeling icons in the ribbon area.
- Model
- The Model tool lets you define initialization information for a model as well as archival information such as a model name, creation date and description.
- Diagram
- The Diagram tool lets you define a context for a diagram and view the parameters for a diagram.
- Super Block
- The Super Block tool converts a group of blocks into a super block. The super block facilitates a group of blocks to function as a single block.
- Mask
- The Mask tool group hides the display of blocks in a diagram to help lessen the complexity of the diagram. The tool group includes options to create, edit, remove and restore a mask.
- Orient
- The Orient tool group automatically positions selected blocks and links in a diagram. The tool group includes options to flip or rotate blocks.
- Align
- The Align tool group automatically positions selected blocks and links in a diagram. The tool group includes options to align blocks to the left, right, top or bottom.
- Center
- The Center tool group automatically positions selected blocks and links in a diagram. The tool group includes options to center blocks horizontally or vertically.
- romAI Director
- Launch romAI Director.
Export
Click the Export option in the Menu bar to open the export icons in the ribbon area.
- Export
- Generate C code from a super block to create new blocks, export to other simulation environments, and generate standalone applications.
- OML
- Export to OML.
- Modelica
- Export the Modelica component from the current model.
- Model Report
- Create a report to capture model information and simulation results.
Tools
Click the Tools option in the Menu bar to open the tool icons in the ribbon area.
- FMU Editor
- Edit an FMU, hide or expose variables and attributes, and save and export a customized FMU.
- OML Editor
- Write, edit, and run OML scripts.
- Python Editor
- Write, edit, and run Python scripts.
- Curve Editor
- Manually design and manage a time signal curve.
- Block Builder
- Build a block using an interactive tool.
- UI Designer
- Create a GUI with predefined objects from the UI Designer toolkit.
- Plot Assistant
- Plot data from a delimited file or your OML workspace and modify the plots.
- Optimization
- Define cost and constraint functions and parameters, and generate a reusable OML script for a given optimization problem.
- MAT Explorer
- GUI for .MAT files.
- Spice Netlist
Project Browser
The Project Browser displays a tree view of all model data open in a current session.
The Project Browser lets you navigate between models, model hierarchy, and objects in the models such as blocks and super blocks. The tree includes a dedicated branch for all plots and scopes created in a current session.
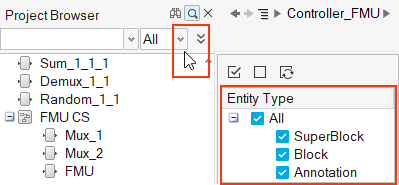
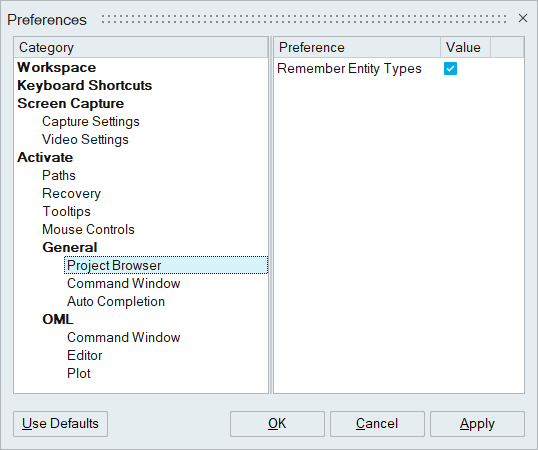
To retain your display selections, from the dialog, select Remember Entity Types.
Property Editor
The Property Editor displays the properties of a selected object and enables you to assign properties such as a name to various objects in a model.
Command History
The Command History window displays the OML command history for the current session.
Variable Browser
The Variable Browser provides access to all variables available for the current session.
Demo Browser
The Demo Browser provides easy access to models and other model-related files.
Accessing Files from the Demo Browser
The tree of the Demo Browser lets you access files from designated directories.
- OML scripts that are authored or executed from the OML Editor.
- Any .sclin or .scopt files that are authored or executed from the Optimization Editor.
- Any .scm, .oml or .sclin files, or files in the demo directories that are associated with the installed toolboxes or libraries.
- Match Case
- Whole Names Only
- Use Wildcards
- Show Only Files Containing Block or Component
Modeling Window
The modeling window is the area in the workspace where you construct models using a hierarchical system of block diagrams.
The modeling window lets you construct diagrams with user-defined blocks or predefined blocks from the software's block library. A variety of tools are available for editing diagrams in the modeling window, including an OML editor.
OML Command Window
The OML command window lets you enter individual OML commands to create or modify block definitions; create, edit or simulate models; manipulate elements inside of diagrams; and define functions for the pre- and post-processing of data required for model simulations.
Python Command Window
The Python command window lets you enter individual Python commands supported by the Python interpreter (3.5.4 for the current release) included with Twin Activate.
The Python command window gives access to of all the commands supported by the Python interpreter (3.5.4 for the current release) that is included with Twin Activate.
The Python package in Twin Activate provides a number of modules such as numpy, scipy and many more.
Additional packages can be added using the standard Python commands (pip).
File Browser
The File Browser displays the files in the current working directory.
The current working directory is the path displayed by the OML command pwd(). You can change the current working directory in the File Browser by applying the function cd() or navigating directories.
Palette Browser
The Palette Browser provides access to the library palettes which hold collections of predefined and user-defined blocks.
The Palette Browser displays blocks as icons in the right pane and a tree view in the left pane. The standard installation includes the Activate and Modelica palettes.
Message Center
The Message Center window shows the model name, status, and elapsed time of a simulation. Warnings are also shown for any errors that occur during the simulation phases.
- From the View menu, select Message Center.
- From the status bar, click
 .
. - From the menu bar, select to select one of the following display preferences under Show
message center:
- Only Manually
- Automatically for Errors
- Automatically for Errors and Warnings
- Automatically for Every New Message
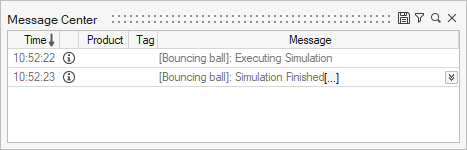
Columns
- Time
- The time that the message was logged.
- Priority
- Displays the priority of each message with an icon.
- Product
- The product that generated the message.Note: The product name is displayed only if the information was provided when adding the message.
- Tag
- Displays the message tag.Note: The tag is displayed only if the information was provided when adding the message.
- Message
- Displays the message.
- When the message is collapsed, two icons are displayed:
-
- When expanded, the chevron icon changes. Click

to collapse the message again.Figure 2. 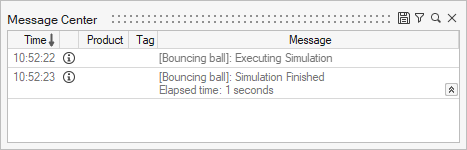
Filter and Save Messages
| Tool | Description |
|---|---|
| Saves all messages to a text file (.txt). To save
specific messages:
Left-mouse button click on the Save icon to display the file browser to save all messages. |
|
Filters the message type(s) displayed. The number next to the icon indicates
how many of each message type are logged in the Message Center. Click a message type to only display those
messages.  When all filters are off, all messages are shown. This is the default. |
|
| Displays the Search field. The search starts when you press Enter or click to the right of the Search field. The search results are highlighted. |
Context Menu Options
- Copy Selected Text
- Double click text in a message to turn on the Copy Selected Text option.
- Copy Selected Messages/Delete Selected Messages
- Copies or deletes the selected message(s), respectively.
- Select All Messages/Delete All Messages
- Selects or deletes all messages, respectively.
- Empty Area Selection
- Click in the white space of the Message Center to deselect all messages.
- Ctrl/Shift
- To select multiple messages, press Ctrl as you select the messages.
By default, the message log can store up to 1,024 messages. If this limit is exceeded while running the application, the oldest message(s) will be overwritten. You can use the API commands to change this limit as necessary. However, as the limit is increased, the amount of memory used by the application also increases.