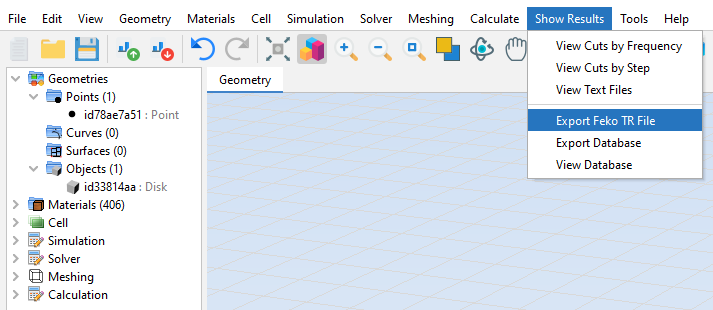
Show Results Menu
This option allows the user to see the results obtained on the project simulation.
Most of plots show 2-D curves of a result field versus an input parameter. This type of graphics share additional features of zoom, raxis and curves edition, and so on. To read more information about the chart options (when clicking on the right button over a chart) see Annex 1: Graphics Advanced Options.