Visualizing Results
For each possible result type (field, propagation factor and path loss), there are three possible visualization options show the results at a given height for every possible value of range, show the results at a given range for every value of height, or show a color map of the value of the results of all the profile. The options under each submenu of the "Results" menu allow to choose between the three possibilities:

By Height or Range
When any 'at Range' or 'at Height' option is selected, a new panel will be opened and will look like the one in the following figure:

In this panel, it is possible to select the simulation case the user wants to show the results for, as well as the range or height value, depending on the visualization mode. To add a new series, the user needs to press the "Add Series" button after selecting the simulation case and range/height value.
In addition, the user can manage the added series by using the "Options" panel. In this panel, the user can remove series, change the color of a series and import/export series from/to text files.
Color Map
If any of the 'Spectrum' options is selected a panel like this will appear:
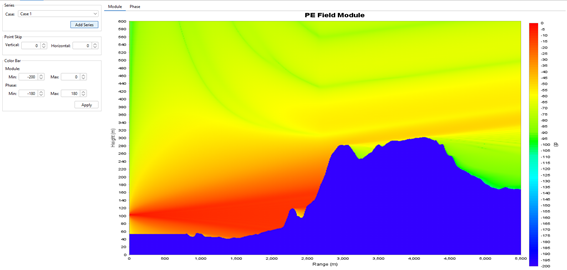
In this panel, only one result set can be shown at once. To add or change a set, the user must select the appropriate case, select the point skip, explained in the import terrain section and press the "AddSeries" button.
In the Color Bar section, the user can define the range of values represented by the map. Any values lower or higher than the limits will be represented with the same color as the correspondent limit. These values can be changed before of after adding the values. The module or the phase can be changed. To change it afterwards, click "Apply".
If the user wants to see a more detailed view of the values at range or height, pressing right click anywhere in the graph will show a pop-up menu with those options.

Selecting any of those options will add the series to a panel like the one described above at the range or height where the menu was triggered.