View Cuts By Step
This kind of plot lets the user analyze RCS measurements made by the simulation proves for a particular component, frequency, theta or phi cut and observation point against the parametric steps defined in the project. This option is useful when the user has parametrized a simulation by adding parameters and making objects such as geometries depend on the parameters themselves.
When this option is chosen from the Show Results > Far Field > View Cuts by Steps menu, the panel presented below will appear:
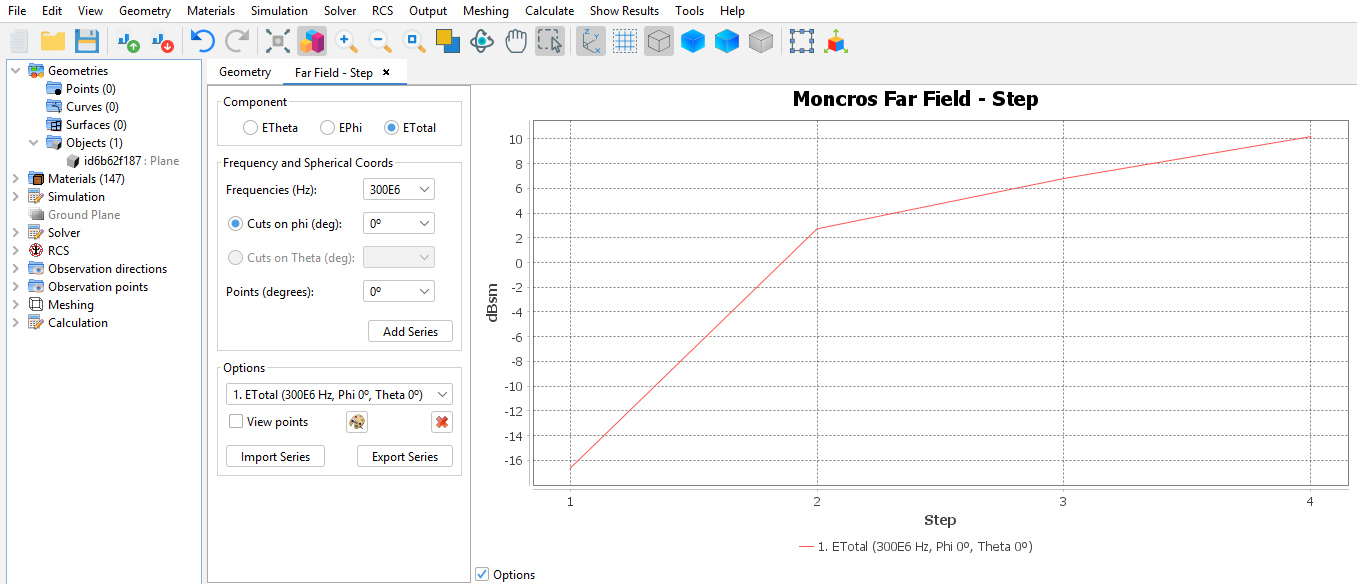
Similar to the behaviour of the standard Far Field chart, this panel displays a plot with the results and a control panel where the user can add, modify and remove series that are then displayed in the chart. A default series will be added automatically to the plot, but the user can add new series by modifying the values in the control panel and pressing Add Series for adding the series to the panel. The following settings can be modified:
- Component the plane wave component to inspect. Select one of the possible values Eθ, Eφ or Et.
- Frequency if a frequency sweep has been made, multiple frequencies may be available for selection.
- Cuts on phi / Cuts on theta select one of the cuts that were previously added as observation points to the project.
- Point select one of the samples made for this observation direction.
The selected series can be added to the plot by pressing the Add Series button. It is also possible to modify the look and delete series previously added to the chart. You can change the color of a particular series by selecting it in the list and pressing the Change Colors. To remove a series from the plot representation, press the Remove series button.
Series can be imported and exported. To save a series press the Export series button. Later it is possible to load previously exported series by pressing the Import Series button and locating the file where the results were saved in.