View Near Field Diagram
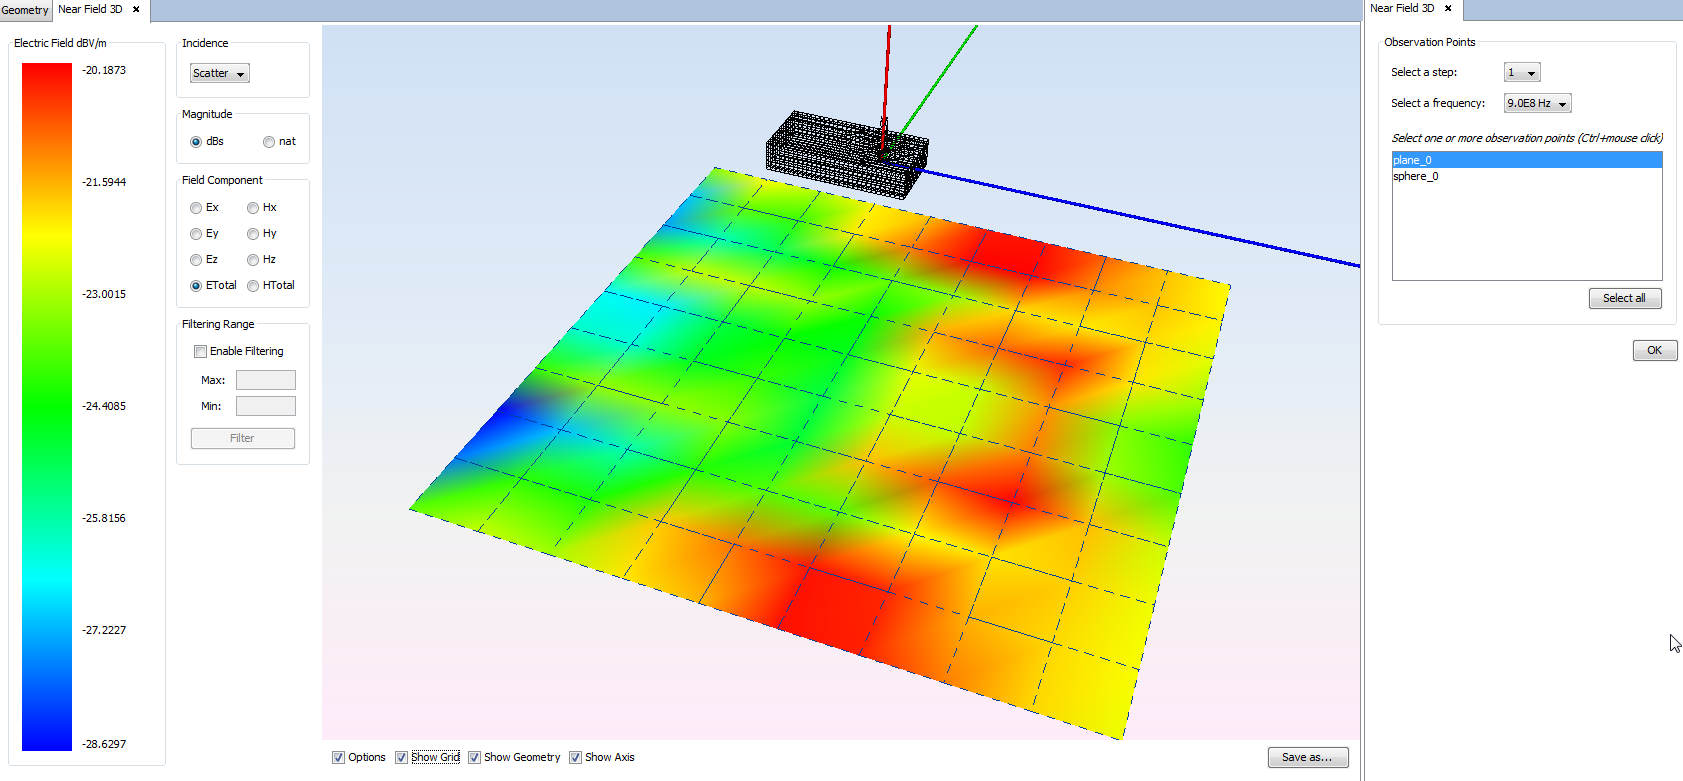
After clicking on Show Results - Near Field - View Near Field Diagram, a new panel is opened on right side to select which observation points are considered in the diagram. In this panel, the following options are available:
- Step To specify the step results files when a parametric simulation has been run.
- Frequency To specify the desired frequency results files when a frequency sweep has been run.
- Observation points List with all the observation points entities defined. Select the desired ones to plot the near field results.
- Select all Click on this button to select all the observation points entities.
- Ok Confirm the observation points to plot and open the Near Field 3D diagram.
Then, the options available in the Near Field 3D results panel are listed:

- Left color legend it shows the magnitude and range of values of the represented results.
- Incidence The near field may be plotted by considering
different contributions on the observation points.
- Scatter Scattered field components.
- Direct Direct field components.
- Total Combination of the scattered field plus the direct field components.
- Magnitude The near field may be represented in natural or dBs
magnitudes.
- dBs The near field is represented in logarithmic scale, given in dB-Amperes per meter for magnetic field, or in dB-Volts per meter for electric field.
- nat The near field is represented in natural scale, given in Amperes per meter for magnetic field, or in Volts per meter for electric field.
- Field Component To specify the field component to plot. Only
one component may be selected:
- Ex Plot the X component of electric field.
- Ey Plot the Y component of electric field.
- Ez Plot the Z component of electric field.
- ETotal Plot the total electric field, which is the combination of the X, Y and Z components.
- Hx Plot the X component of magnetic field.
- Hy Plot the Y component of magnetic field.
- Hz Plot the Z component of magnetic field.
- HTotal Plot the total magnetic field, which is the combination of the X, Y and Z components.
- Filtering Range Use this section to skip results that are outside the desired range.
-
- Enable Filtering The filter only is applied when this check box is selected.
- Max To specify the maximum value of the range.
- Min To specify the minimum value of the range.
- Filter Click on this button to update the results filtering.
- Bottom Options Below the near field diagram, the following options are included:
-
- Options Disable this option to hide the left menu and visualize just the near field diagram.
- Show Grid Enable this option to visualize the grid of the near field observation entity.
- Show Geometry Enable this option to visualize the meshed geometry together the near field diagram.
- Show Axis Enable this option to show the coordinate axes.
- Save as To export the current representation as an image file.