Antenna Coupling by Frequency
This kind of plot can be used to compare the coupling obtained by the simulation process against a frequency sweep. This option is useful when the user has selected a frequency sweep in the Simulation Parameters, in order to inspect how the coupling value change through a frequency sweep.
When this option is chosen from the Show Results > Coupling > Antenna Coupling By Frequency menu, the panel presented in the figure below will appear.
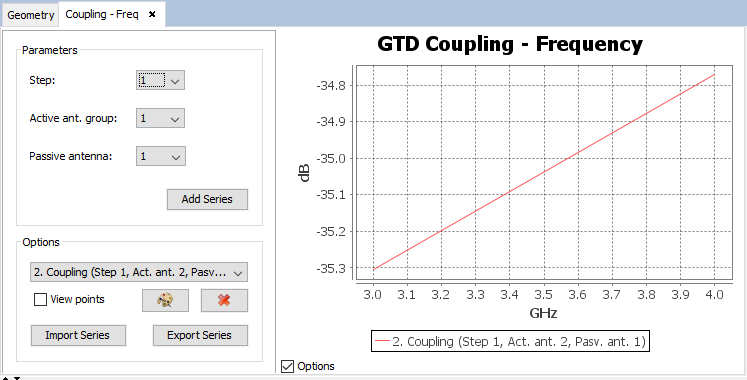
This panel displays a plot with the results. More series can be added by selecting the step in the control panel that appears on the left side of the plot.
- Step: the parametric step to select. These should have been defined prior to the calculation when designing the simulation.
- Active ant. group: the individual antenna or antenna array that acts as an active antenna.
- Passive antenna: the antenna that acts as passive antenna.
The selected series can be added to the plot by pressing the Add Series button. It is also possible to modify the look of a series previously added to the chart. You can change the color of a particular series by selecting it in the list and pressing the Change Colors.
Series can be imported and exported. To save a series click on the Export series button. It is possible to load previously exported series by pressing the Import Series button and locating the file where the results were saved in.