Displaying Key Values Across in a Summary
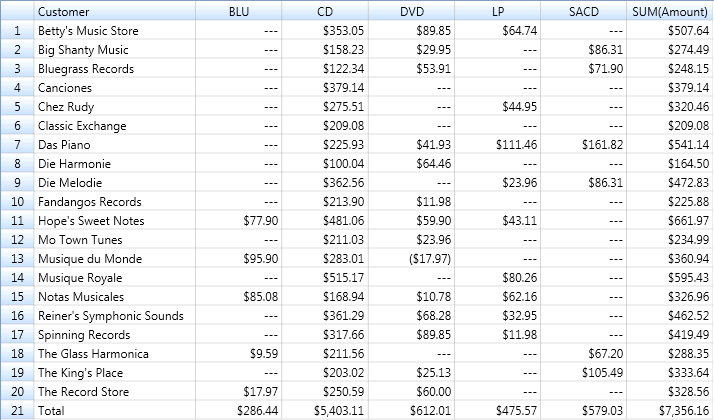
You can modify a summary to display the values for a key field across the top row, creating a two dimensional matrix. This format, sometimes called a crosstab summary, is more compact, allowing for quick comparisons of multiple data groups, but it cannot include item fields.
An example of a crosstab summary appears in the following illustration.

Summary with Media field values displayed across.
-
Go to Summary Design.
-
Select a Summary from the Summaries selector. The Summary's properties are displayed on the Summary Window.
-
Select Keys from the Summary Design ribbon.
-
Select a key field from the fields selector to display that field's tabs and properties.
-
Go to the Layout tab.
-
Select the Across (row) radio button.
-
Choose Accept.
Note that you will not be allowed to display key values across if the Summary definition has item fields defined.
Monarch Classic re-displays the summary with the values for the selected key spread across the top row.
Note: See Displaying Multiple Measures in Across Key Summaries for related information.
© 2025 Altair Engineering Inc. All Rights Reserved.