Summary Keys Window
Use this window to modify the properties of a key field in a summary.
Key fields are used to generate the summary matrix. You select the fields that you want to tabulate, such as all customers or all product types in the order that you want to break out the field values. For each key field Monarch Classic produces a list of all values found within the field. The values are then combined with values from other key fields to create each line in the summary. For example, a Customer field with the values "Betty's Music Store" and "Big Shanty Records" and a Media field with the values CD, DVD, LP and SACD will produce six summary lines as shown in the illustration below.
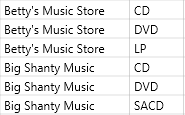
Summary lines created using Customer and Media as key fields.
In this example, the Customer field is the first key and the Media field is the second key. The resulting summary will break out each media type within each customer.
Notes:
-
If you want to add or remove keys, use the Add/Remove Fields window.
-
If you want to edit all summary fields, use the Summary All Fields window.
Displaying the Keys window
-
Go to Summary Design.
-
Select a Summary from the Summaries selector. The summary's properties are displayed on the Summary Window.
-
Select Keys on the Summary Design ribbon.
-
Select a Key field on the Keys field selector. The field's tabs and properties are displayed.
Key Field Options
General
|
Field |
Description |
|
Title |
Accepts a string representing the column title. Column titles must adhere to the naming conventions used for long names. Column titles are initially assigned by Monarch Classic based upon the name of the field used to create the key column. For key fields whose values are spread across the top row of the summary grid, the key field values are used as the column titles and cannot be changed. To change the column title, you must first clear the "Use Default Title" check box, then enter a new column title in the Title box. |
|
Use Default Title |
When selected, the default title is used. The default title is the name of the field used to generate the key column. Clear this option if you want to enter a new title for the column. |
|
Width |
Accepts a value representing the width of the column on screen. If the width of a numeric key column is set to less than the width of the values in the column, the column displays pound signs (####). For character columns and date columns, the values are truncated on screen. All columns generated by an across key share a common column width. If you change the column width for any one of the across key columns, all of the related columns will automatically use the new width. |
|
Display: Hidden |
When this is checked, the corresponding summary column is hidden. A hidden key field may still be used for sorting purposes. Note: Hidden columns do not get exported. |
Matching
|
Field |
Description |
|
All Values |
Select this option to build the summary using all available key field values. |
|
First n Values |
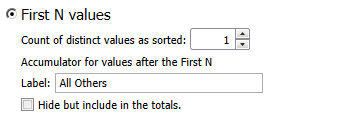
Select this option to build the summary using only the first N key field values.
This option is applied after the summary is sorted. By selecting the Measure sort option (see the Measure option on the Sorting tab below), you can use this feature to display a top n analysis or bottom n analysis of your data. For example, you can use this feature to create a summary that breaks out total Sales amounts for each Salesperson in your company, then limits the summary to only the top ten salespeople. By selecting Salesperson as a key field and Sale_Amounts as a measure, you could then sort the Salesperson key by the Sale_Amounts measure (in descending order). This would result in a summary that displays salespeople ranked by total sales, with the top selling salesperson first and the bottom selling salesperson last. You could then select the First n Values option for the Salesperson key, setting n to 10. The resulting summary would display the top ten salespeople in terms of total sales, with all other salespeople grouped together under a single label (the "All Others" label). |
|
Values from table |
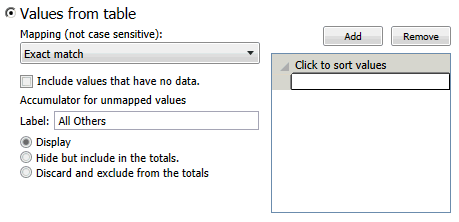
Select this option to build the summary using only those key field values you specify:
Another use for this option is to create a specific sort order for the key values. Monarch Classic allows you to sort by key fields or measures, but the order is ascending or descending, either alphabetic or numeric, depending on the field type. There are some cases where you want to define the sort order exactly, e.g., with months of the year. Use the Add current values button to select key field values from a list or type your own list of values that you want to use when building the summary. Monarch Classic will follow the order in the which the values are displayed on the list. Use the Mapping drop-down select how values are mapped:
Click include values that have no data to include the value in the summary, even if there are no matching records found in the report. Accumulator for unmapped values label will be used to identify all values that are not included in the list. You can also select to display, hide, or discard all unmapped values. |
|
Measure limit: |
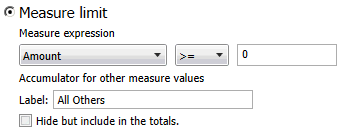
Select this option to build the summary using only those key fields where a selected measure’s subtotal value meets either an upper limit or a lower limit. The lower limit is expressed as "at least n" and the upper limit is expressed as "at most n".
For example, when creating a summary to show product quantities broken out by Customer, you might want to view only those customers whose purchase amounts are greater than $5000.00. By selecting Customer as a key field and Amount as a measure, you could then select the Measure limit option, select Amount from its drop-down list, select the ">=" operator, and enter $5000 in the associated edit box. The resulting summary would display all customers that purchased more than $5000.00, with all other customers grouped together under a single label (e.g., the "All Others" label). |
|
Time Interval |
When this option is selected, the Time Interval Values edit box on the right lists the time intervals which span the range of date/time values currently present for the key field as filtered by the summary’s applicable filter.
This is precisely the range that will be applied when the summary is actually computed. Note: This option is enabled only when the key field is of type date/time. Use the drop-down list to select the type of time interval you wish to apply to the key field. |
Sorting
|
Field |
Description |
|
Sort by |
|
|
Key field |
Select this option to sort a Key field by its own values or by the position in the specified values list. |
|
Order By: |
Note that Position in Specified Values List and Time Interval Expansion are available only if you defined Values from table or Time Interval in the Matching sub-tab. |
|
Measure |
Select this option to sort a Key field by the values of a measure. This option is useful for arranging the summary to show key field values ranked from largest to smallest or vice-versa. For example, when creating a summary to show Sales broken out by Salesperson, you might want to rank the salespeople according to total sales, rather than by name. By selecting Salesperson as a key field and Sale_Amounts as a measure, you could then sort the Salesperson key by the Sale_Amounts measure in order to accomplish the desired result. |
|
Direction |
|
|
Ascending |
Select Ascending to sort in ascending order. |
|
Descending |
Select Descending to sort in descending order. |
Layout
|
Field |
Description |
|
Orientation: |
|
|
Across (row) |
Select to display the key field values along the x-axis (spread across the top row of the summary grid, forming a two dimensional array). Only a single key field may be displayed across. If another key is already designated as the across key, this option will be unavailable. |
|
Down (column) |
Select to display the key field values along the y-axis (down the left edge of the summary grid). |
|
The following options are available if you select Across (row): |
|
|
Hide the across total column |
Select to hide the across total column in the summary. |
|
The following options are available if you select Down (column): |
|
|
Before each key value change Insert header line |
Select to insert a header line before each key value change. |
|
Text |
Enter text to describe the key. This option becomes available if you insert a header line. You can also select additional options to display the key value together with the text:
|
|
Insert n blank line(s) after header line |
Select this option to insert a blank line after the header. |
|
Key Values |
Use the drop-down to select how key values are displayed:
|
|
After each key value change insert subtotal line |
Select to insert a subtotal line. A subtotal line accumulates all the measures for the current key. |
|
Insert n blank line(s) after each key value change |
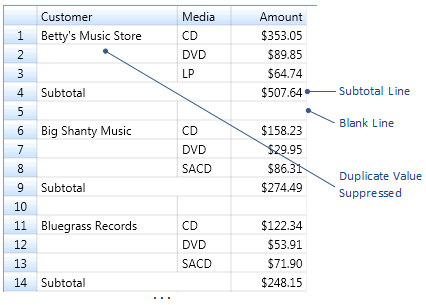
Select this option to insert a blank line at the end of a key field group (see illustration below). When the "Insert subtotal line..." option is also selected, Monarch Classic inserts the subtotal line first, then the blank line. |
|
Text |
Enter text to describe the subtotal. By default the word "Subtotal" is used. You can also select additional options to display the key value together with the text:
|
|
Insert page break when printing |
Select this option to insert a page break prior to printing each new key field value. When the "Insert Subtotal Line..." option is also selected, Monarch Classic inserts the subtotal line first, then the page break. This option is applied only when the summary is printed and is not represented on screen.
|
Coloring
|
Field |
Description |
|
Default coloring defined for the Summary |
Select this option to use the defaults that have been defined. Default preferences may be set using the Design Preferences Wizard . |
|
Override for entire column |
Select this option to override the defaults and define colors for the currently selected key column. If you click on this option, a color sample initially displays. Click the Edit button beside the preview box to display the Color Properties Dialog then use the dialog to set the text color, fill color, pattern style and pattern color.
|
|
Override for selected sections |
Select this option to override the defaults and define colors for the header, key values, and/or subtotal. If you click on this option, color samples will display for each section. Click the Edit button beside the preview box next to a section to display the Color Properties Dialog then use the dialog to set the text color, fill color, pattern style and pattern color.
Check Suppressed duplicate keys use key values coloring if you want suppressed duplicate keys to use the same colors as the key values. Check Apply subtotal label coloring to measure columns to make measure columns use the same colors as the subtotal label. |
© 2025 Altair Engineering Inc. All Rights Reserved.
