Query Plot Data#
Some examples require external input files. Before you start, please follow the link in the Example Scripts section to download the zip file with model and result files.
Example 01 - Get Channel Info#
The DataFile class extracts the header channel information like the data type, requests and components lists from a given plot file by using the methods getDataTypes(), getRequests(), and getComponents().
In addition, the methods getMetaDataList() and getMetaDataValue() provide access to the metadata stored in the file.
 1import hw.hg as hg
 2import os
 3
 4ALTAIR_HOME = os.path.abspath(os.environ["ALTAIR_HOME"])
 5plotFile = os.path.join(
 6    ALTAIR_HOME, "demos", "mv_hv_hg", "plotting", "madymo", "ANGACC"
 7)
 8
 9dtIndex = 1
10dataFile = hg.DataFile(plotFile)
11dataTypeList = dataFile.getDataTypes()
12requestList = dataFile.getRequests(dataTypeList[dtIndex])
13componentList = dataFile.getComponents(dataTypeList[dtIndex])
14metaList = dataFile.getMetaDataList(dataTypeList[1], requestList[0], componentList[0])
15metaValue = dataFile.getMetaDataValue(
16    dataTypeList[1], requestList[0], componentList[0], "HWUnit"
17)
18
19print("Channel Info")
20print("File = " + plotFile)
21print("Reader Version = " + str(dataFile.readerVersion))
22print("Data Types")
23for dataType in dataTypeList:
24    print("  " + dataType)
25print("Requests of DataType = " + dataTypeList[dtIndex])
26for request in requestList:
27    print("    " + request)
28print("Components of DataType = " + dataTypeList[dtIndex])
29for component in componentList:
30    print("      " + component)
31print("Meta Data Label = " + metaList[0])
32print("      Value = " + metaValue)
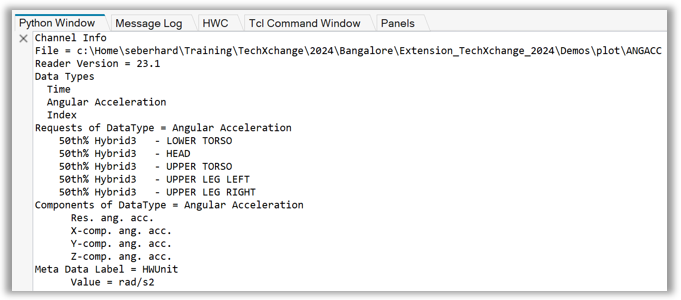
Figure 1. Console Output of ‘Get Channel Info’
Example 02 - Create Data Frames from Plot Files#
In the first part of the script the DataFile class extracts the the data type, requests and components lists from a given plot file by using the methods getDataTypes() , getRequests() and getComponents().
In the second part DataFileQuery class is used to extract both a NumPy array and a Pandas Data Frame based for the given plot channels, here the wildcards “all” where used to extract the full file content of the given data type.
The output is controlled by the outputType argument of the run() method.
 1import hw.hg as hg
 2import os
 3import matplotlib.pyplot as plt
 4
 5ALTAIR_HOME = os.path.abspath(os.environ["ALTAIR_HOME"])
 6plotFile = os.path.join(
 7    ALTAIR_HOME, "demos", "mv_hv_hg", "plotting", "madymo", "ANGACC"
 8)
 9
10dtIndex = 1
11dataFile = hg.DataFile(plotFile)
12dataTypeList = dataFile.getDataTypes()
13requestList = dataFile.getRequests(dataTypeList[dtIndex])
14componentList = dataFile.getComponents(dataTypeList[dtIndex])
15
16dataFileQuery = hg.DataFileQuery(plotFile)
17dataFileQuery.dataType = dataTypeList[dtIndex]
18dataFileQuery.requests = "all"
19dataFileQuery.components = "all"
20dataFileQuery.includeTime = True
21
22print("Numpy Array")
23numpyArr = dataFileQuery.run("numpy")
24print(numpyArr)
25
26print()
27print("Plot Pandas Data Frame")
28pandasDataFrame = dataFileQuery.run("pandas")
29pandasDataFrame.plot(figsize=(25, 20))
30plt.show()
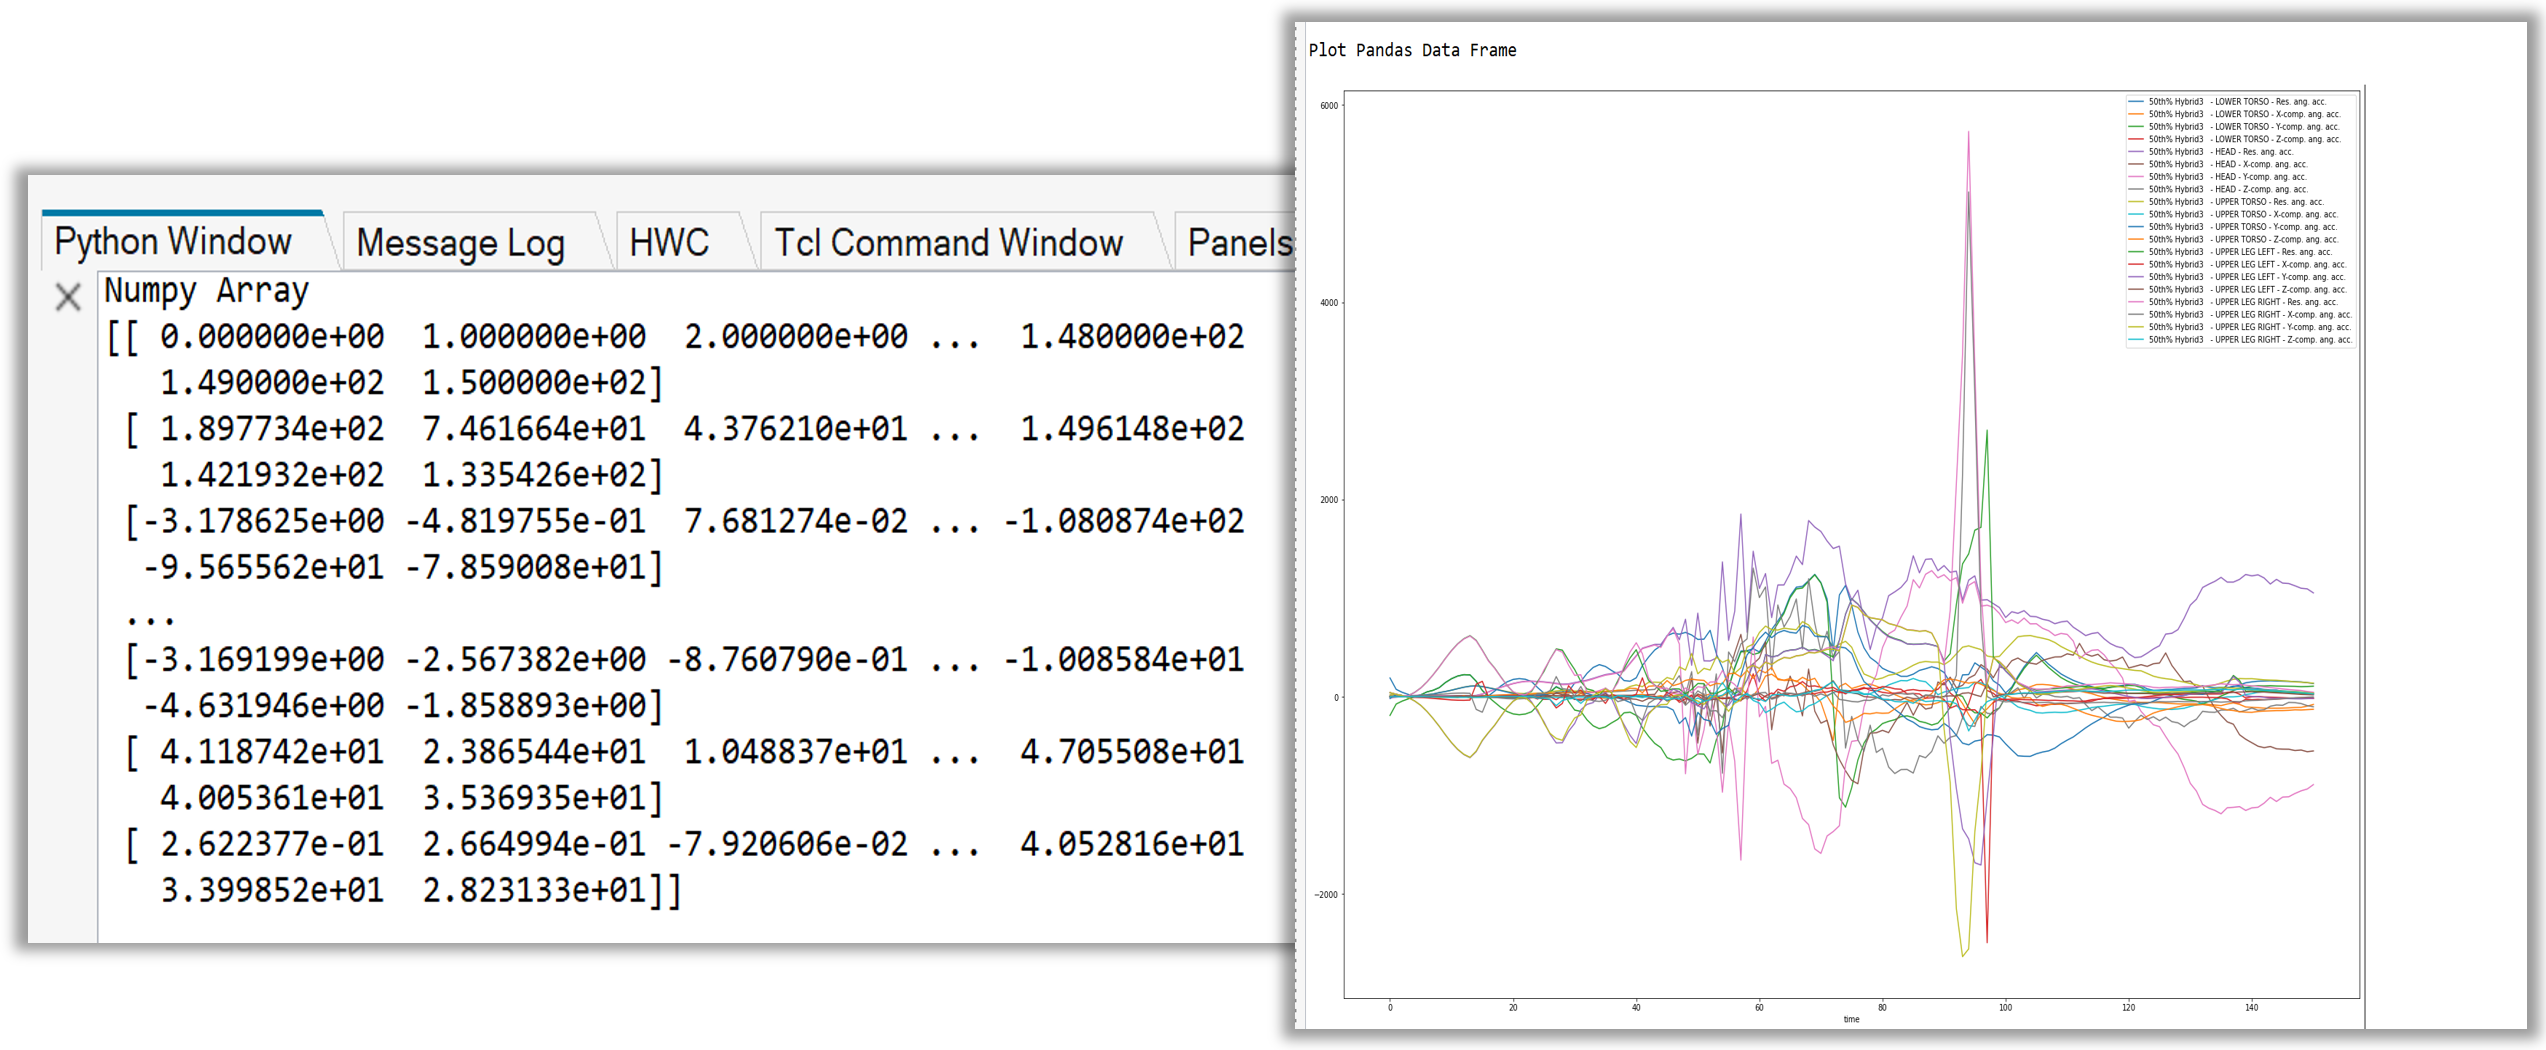
Figure 2. Console Output of ‘Create Data Frames from Plot Files’