Multiple Curve Plotting#
Some examples require external input files. Before you start, please follow the link in the Example Scripts section to download the zip file with model and result files.
Example 01 - Create Multiple Plot Layout#
The code creates multiple pages based on channel and formatting information stored in a dictionary. It also performs filtering and trimming of all inserted curves and adds notes and datum lines positioned on the maximum of curves displaying the curve values. The steps performed by the code are:
Creating pages looping over a range of page indices.
Setting the page title and setting the page layout to 4 plots per page.
Adding resultant, x, y, z angular acceleration curves per window and body part.
Trim and filter each curve.
Position a vertical datum line at the maximum of the resultant curve.
Label the axis using Templex expressions referring to the channel info of the first curve.
Format the legend border style.
Position the legend at the right bottom corner.
Position a note at the maximum of the resultant curve.
  1import hw
  2import hw.hg as hg
  3import os
  4
  5ALTAIR_HOME = os.path.abspath(os.environ["ALTAIR_HOME"])
  6plotFile = os.path.join(
  7    ALTAIR_HOME, "demos", "mv_hv_hg", "plotting", "madymo", "ANGACC"
  8)
  9
 10# New Session
 11ses = hw.Session()
 12ses.new()
 13
 14# Dictionary with curve channel names
 15plotDict = {
 16    "yRequests": [
 17        "50th% Hybrid3   - LOWER TORSO",
 18        "50th% Hybrid3   - UPPER TORSO",
 19        "50th% Hybrid3   - UPPER LEG RIGHT",
 20        "50th% Hybrid3   - UPPER LEG LEFT",
 21    ],
 22    "yComponents": [
 23        "Res. ang. acc.",
 24        "X-comp. ang. acc.",
 25        "Y-comp. ang. acc.",
 26        "Z-comp. ang. acc.",
 27    ],
 28    "lineColors": ["#ff0000", "#00ff00", (0, 0, 255), (0, 0, 0)],
 29}
 30
 31# Create fonts and colors
 32fontAxisText = hw.Font(family="Arial", style="regular", size=14)
 33legendBorderColor = hw.Color(rgb=(204, 204, 204))
 34datumColor = hw.Color(hex="#ff0000")
 35
 36# Loop over pages
 37for index in range(1, 3):
 38    ap = ses.get(hw.Page)
 39    if index > 1:
 40        ap = hw.Page()
 41    ses.setActive(hw.Page, id=index)
 42
 43    # Define page attributes
 44    ap.setAttributes(layout=9, title="HG Demo " + str(index))
 45    i = 0
 46
 47    # One plot per request
 48    for request in plotDict.get("yRequests"):
 49        i += 1
 50        aw = ses.setActive(hw.Window, window=i)
 51        aw.type = "xy"
 52
 53        # Add curves from dictionary
 54        for component, color in zip(
 55            plotDict.get("yComponents"), plotDict.get("lineColors")
 56        ):
 57            cu = hg.CurveXY(
 58                xFile=plotFile,
 59                xType="file",
 60                xDataType="Time",
 61                xRequest="Time",
 62                xComponent="Time",
 63                yFile=plotFile,
 64                yType="file",
 65                yDataType="Angular Acceleration",
 66                yRequest=request,
 67                yComponent=component,
 68                lineColor=color,
 69                label="{y.HWRequest} - {y.HWComponent}",
 70            )
 71
 72            # Add curve math SAE filter
 73            cu.mathAdd("SAE", padding=1, direction=1, filterClass=15)
 74
 75            # Create and Modify curve math trim operation
 76            mathTrim = cu.mathAdd("trim")
 77            mathTrim.setAttributes(start=20, end=140)
 78
 79        # Add vertical datum line at curve max
 80        dv = hg.DatumVertical(
 81            position="c1.x[indexofmax(c1.y)]",
 82            label="Y Max",
 83            labelLocation="upperCenter",
 84            lineColor=datumColor,
 85        )
 86
 87        # Edit vertical axis label using font object
 88        av = ses.get(hg.AxisVertical, curve=cu)
 89        av.text = "Max of Resultant = {max(c1.y)}"
 90        av.font = fontAxisText
 91
 92        # Modify Header values
 93        header = ses.get(hg.Header)
 94        header.setAttributes(visibility=True, text="Demo Window " + str(i))
 95
 96        # Modify Legend Style
 97
 98        legend = ses.get(hg.Legend)
 99        legend.setAttributes(
100            borderColor=legendBorderColor,
101            borderStyle=3,
102            placement="insideRightBottomCorner",
103        )
104
105        # Create note at maximum of curve 3
106        note = hg.Note(
107            attachTo="curve",
108            attachmentCurve=1,
109            attachmentPoint="indexofmax(c1.y)",
110            text="Max = {y} @ {x}",
111            autoPosition=True,
112            autoPositionStrategy="right",
113            curveColor=True,
114        )
115
116        # Update() recalculates, fits and draws
117        aw.update()

Figure 1. Output of ‘Create Multiple Plot Layout’
Example 02 - Plotting Curves from Single File#
Using the CreateCurvesByFile class allows to plot multiple pages and windows similar to the functionality available in the “Create curves by file “ GUI.
This class supports as attributes the data file, a single data type and request and component lists for the plot channel definitions.
In this example the wildcards “all” are used to plot all requests and components in the data file.
The attribute layoutType = 1 defines two plots per page side by side, the attribute layoutOrganisation = “onePlotPerRequest” plots all components of each request in one plot.
 1import hw
 2import hw.hg as hg
 3import os
 4
 5ALTAIR_HOME = os.path.abspath(os.environ["ALTAIR_HOME"])
 6plotFile = os.path.join(
 7    ALTAIR_HOME, "demos", "mv_hv_hg", "plotting", "madymo", "ANGACC"
 8)
 9
10ses = hw.Session()
11ses.new()
12win = ses.get(hw.Window)
13win.type = "xy"
14
15dataTypeList = ["Time", "Angular Acceleration", "Index"]
16dataType = dataTypeList[1]
17
18createCurves = hg.CreateCurvesByFile()
19createCurves.file = plotFile
20createCurves.yDataType = dataType
21createCurves.yRequest = "all"
22createCurves.yComponent = "all"
23createCurves.layoutType = 1
24createCurves.layoutOrganisation = "onePlotPerRequest"
25createCurves.run()
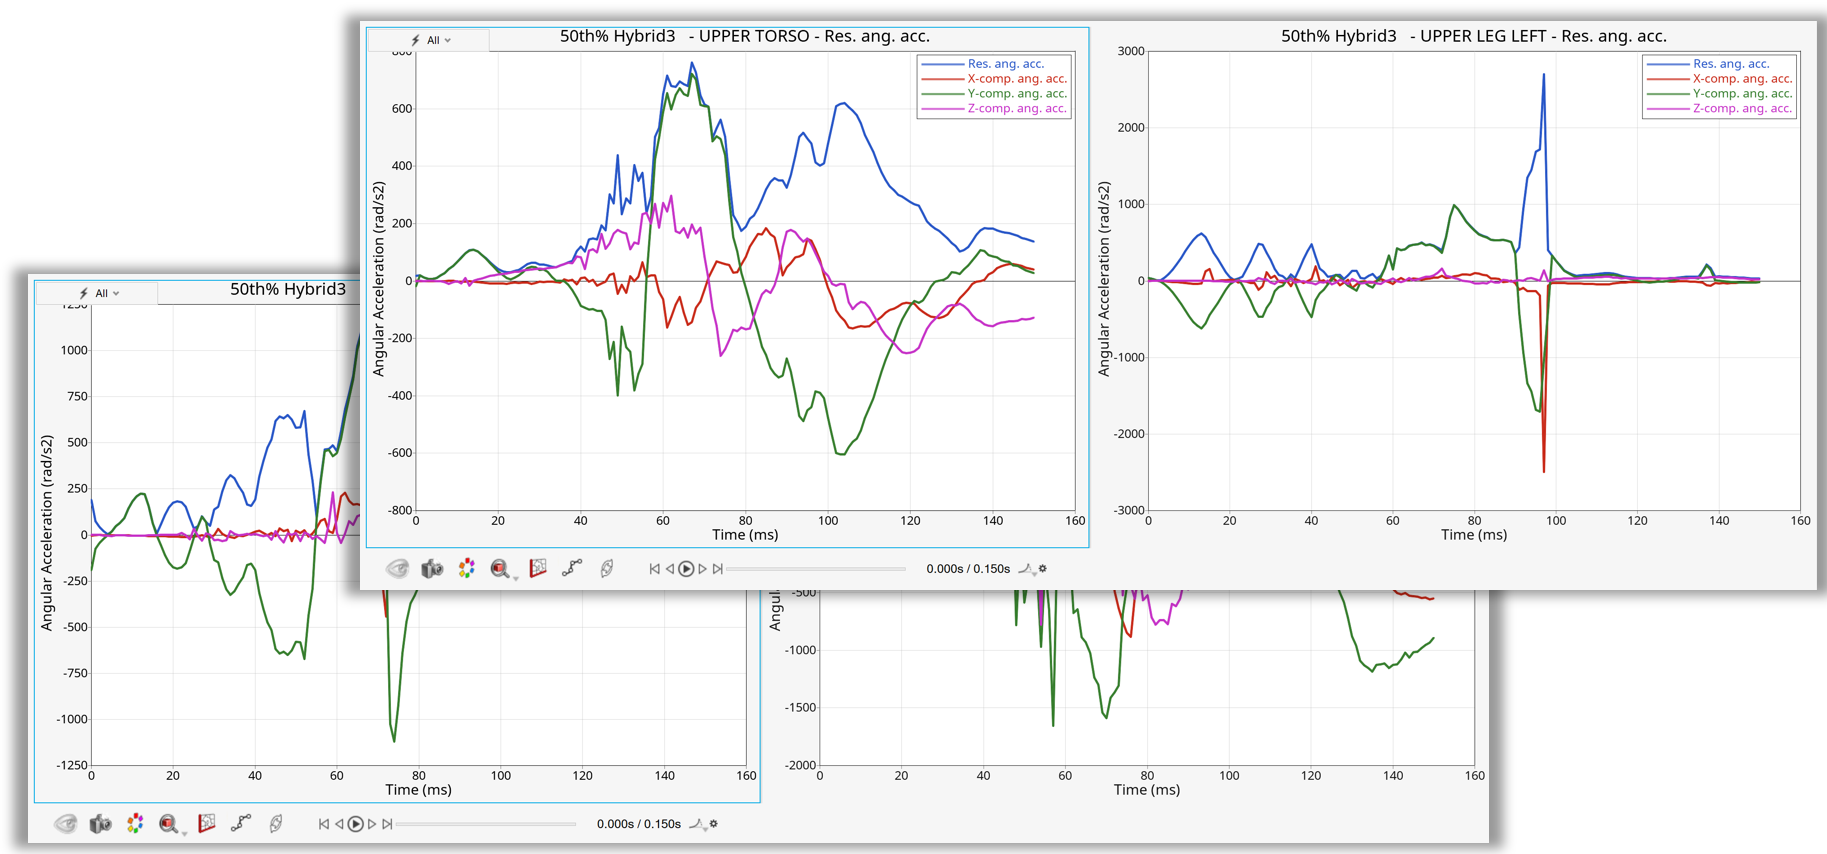
Figure 2. Plotting Curves from Single File
Example 03 - Plotting Curves from Multiple Files#
The following example uses Python API’s to perform the “Create Curves by File” functionality plotting from multiple files in one shot.
In the first step the DataFile class extracts the header channel information like the data type list, the request list and the component list from a given plot file.
In the second step the MultipleFiles class creates a file set using a root directory and a list of relative file paths from this directory to the required plot files. In addition, the format options for the label prefix are set. Finally, the createFileSet() method creates the file set.
In the third step the CreateCurvesByFile class is used to plot all the page and windows. The main difference to the single file plotting is that file attribute points to the file set from the second step. For the data type, requests and components of the channels the lists from step one are used.
 1import hw
 2import hw.hg as hg
 3import os
 4
 5scriptDir = os.path.abspath(os.path.dirname(__file__))
 6multipleFileDir = os.path.join(scriptDir, "doe_1")
 7plotFile = os.path.join(scriptDir, "doe_1", "run__00001", "m_1", "boxbeamT01")
 8
 9ses = hw.Session()
10ses.new()
11win = ses.get(hw.Window)
12win.type = "xy"
13
14dtIndex = 1
15dataFile = hg.DataFile(plotFile)
16dataTypeList = dataFile.getDataTypes()
17requestList = dataFile.getRequests(dataTypeList[dtIndex])
18componentList = dataFile.getComponents(dataTypeList[dtIndex])
19
20multipleFiles = hg.MultipleFiles()
21multipleFiles.name = "FS1"
22multipleFiles.directory = multipleFileDir
23multipleFiles.fileList = [
24    "run__00001/m_1/boxbeamT01",
25    "run__00002/m_1/boxbeamT01",
26    "run__00003/m_1/boxbeamT01",
27    "run__00004/m_1/boxbeamT01",
28]
29multipleFiles.labelPrefixSuffix = "dir2"
30multipleFiles.typePrefixSuffix = "prefix"
31fileSet = multipleFiles.createFileSet()
32
33createCurves = hg.CreateCurvesByFile()
34
35createCurves.file = multipleFiles
36
37createCurves.yDataType = dataTypeList[1]
38createCurves.yRequest = requestList[0:2]
39createCurves.yComponent = componentList
40createCurves.layoutType = 1
41createCurves.layoutOrganisation = "onePlotPerRequest"
42createCurves.run()
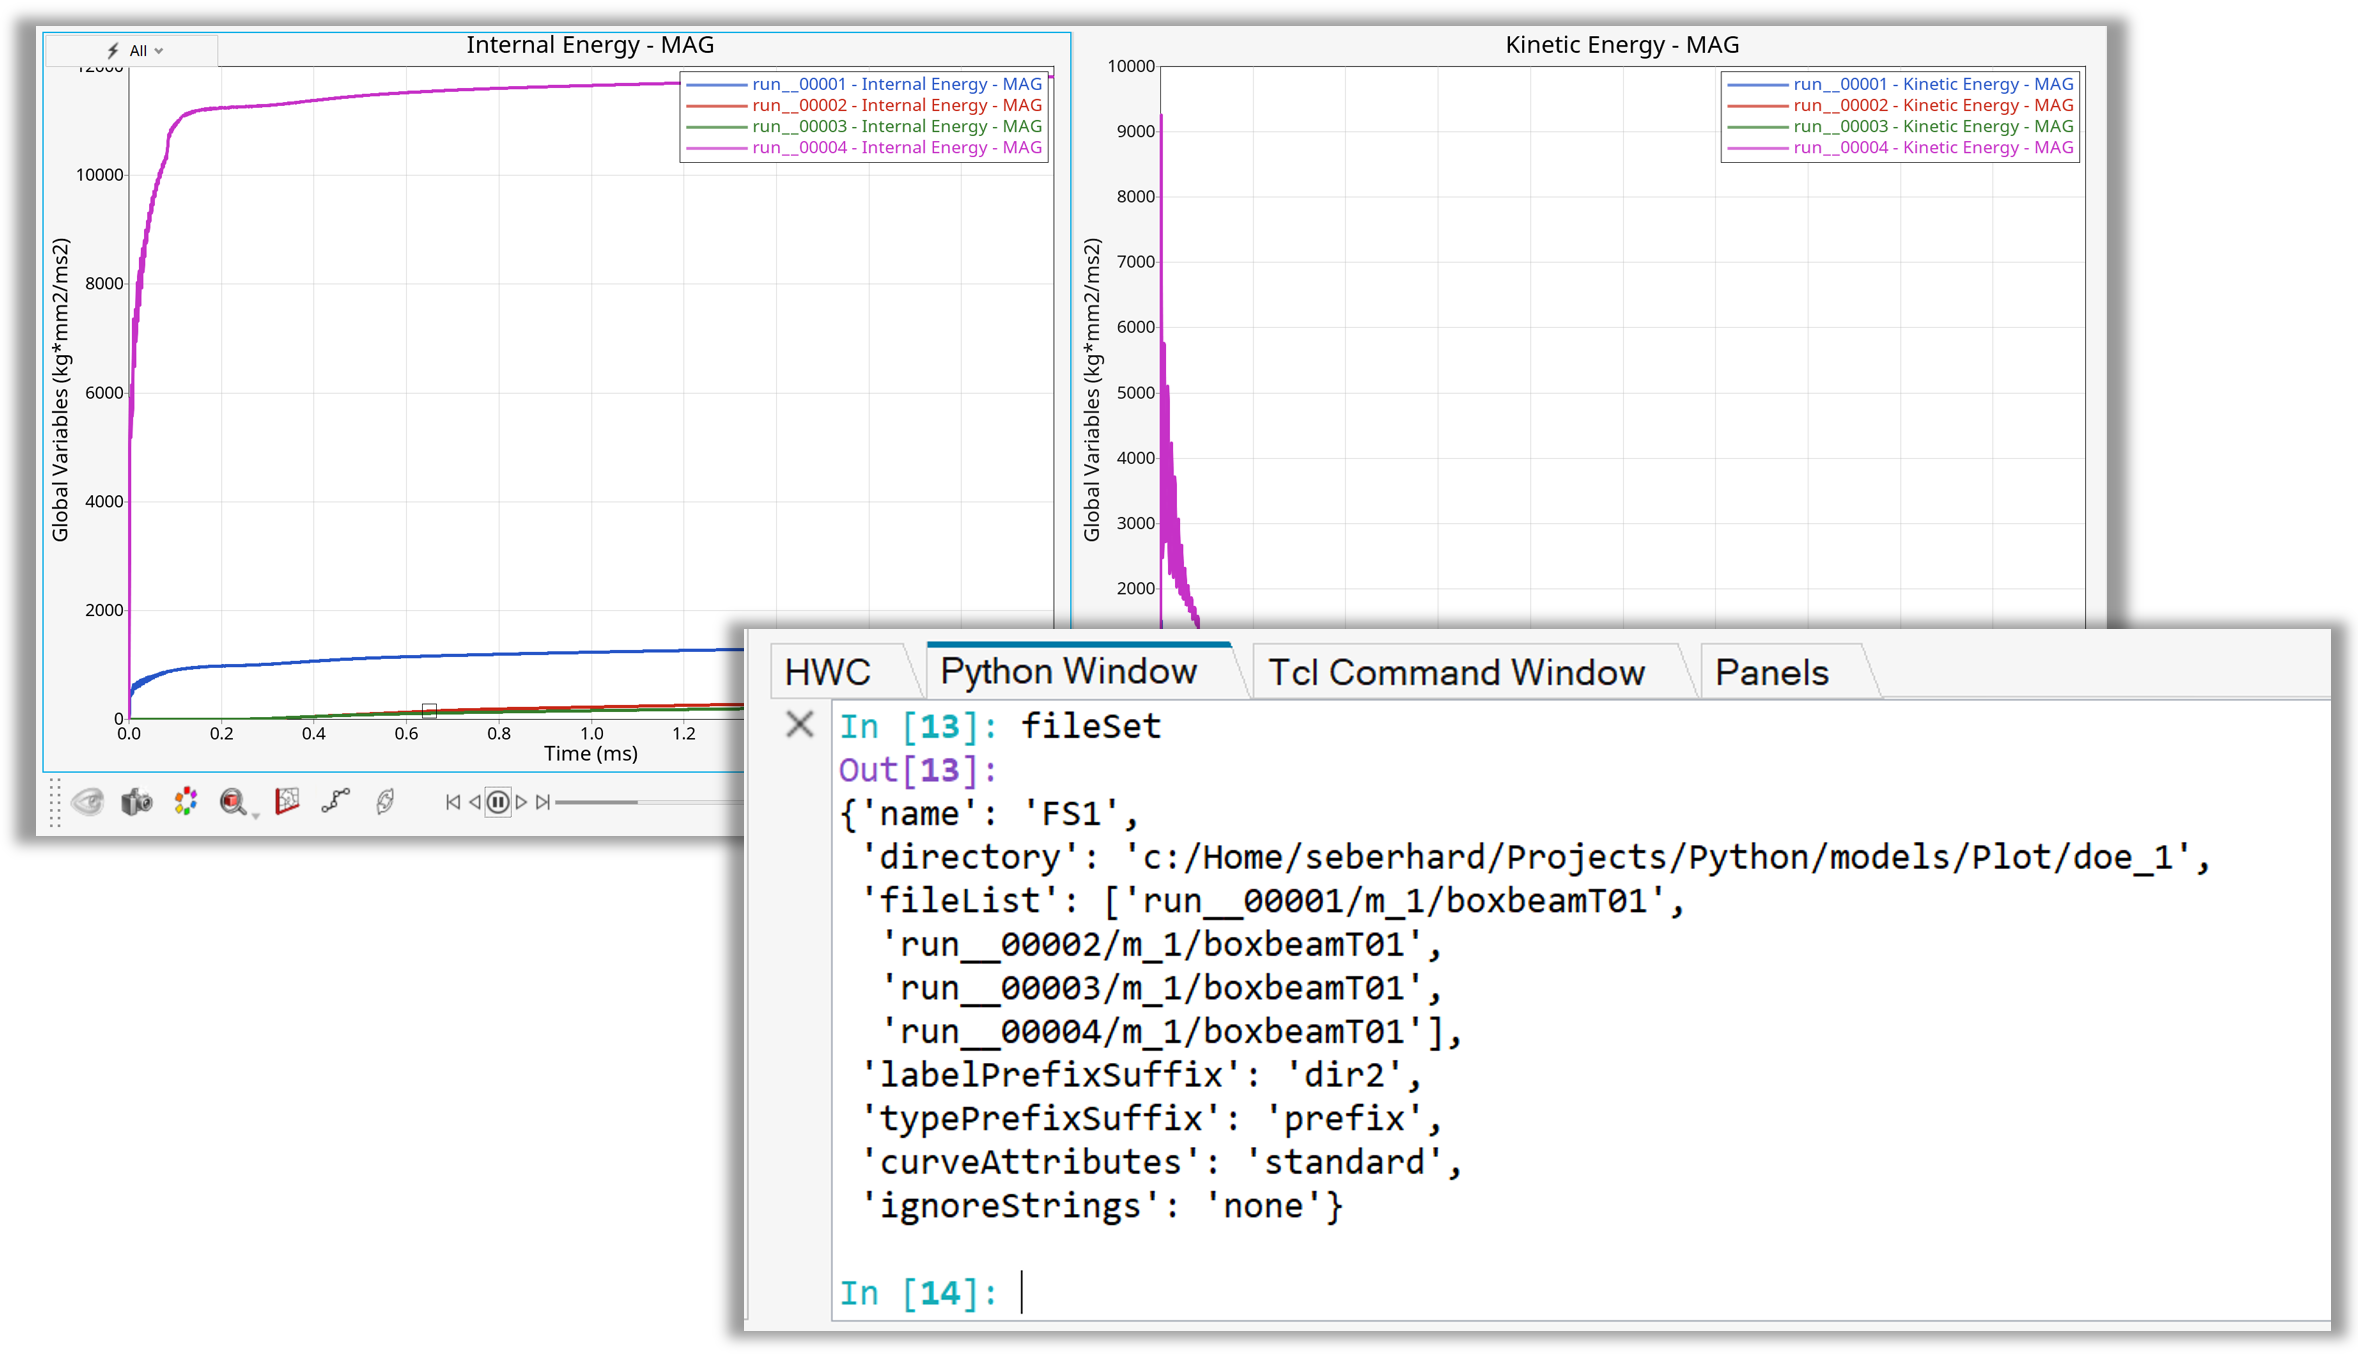
Figure 3. Plotting Curves from Multiple Files
Example 04 - Plotting Curves from Multiple Subcases#
The following code covers the “Create Curves by File” functionality for plotting from multiple subcases with the MultipleSubcases class in one shot.
The DataFile class is used to extract the subcase label list. Then for a given subcase the data type list, the request list and the component are extracted.
A subcase set is created using the MultipleSubcases class. Attributes used are file, subcaseList, and typePrefixSuffix for the prefix settings.
Finally, using the CreateCurvesBySubcase class with sub-ranges of the request and component lists is used to plot from the given the subcase set. The attribute layoutType = 9 defines four plots per page, the attribute layoutOrganisation = “onePlotPerRequest” plots the components of each request in one plot.
 1import hw
 2import hw.hg as hg
 3import os
 4
 5scriptDir = os.path.abspath(os.path.dirname(__file__))
 6plotFile = os.path.join(scriptDir,'plot','10_subcases.h3d').replace("\\","/")
 7
 8ses = hw.Session()
 9ses.new()
10win = ses.get(hw.Window)
11
12df = hg.DataFile(plotFile)
13subcaseList = df.getSubcaseLabels()
14multSub = hg.MultipleSubcases()
15multSub.file = os.path.normpath(plotFile)
16multSub.subcaseList=subcaseList
17multSub.typePrefixSuffix='prefix'
18subcaseSet = multSub.createSubcaseSet()
19print(subcaseSet)
20
21dtl = df.getDataTypes()
22rl = df.getRequests(dtl[1])
23cl = df.getComponents(dtl[1])
24
25createBySub = hg.CreateCurvesBySubcase()
26createBySub.subcaseSet = multSub
27createBySub.yDataType = dtl[1]
28createBySub.yRequest = rl[1:8]
29createBySub.yComponent = [cl[2],'-',cl[-1]]
30
31createBySub.yComponentSorting = 'descending'
32createBySub.layoutType = 9
33createBySub.layoutOrganisation = 'onePlotPerRequest'
34
35createBySub.run()
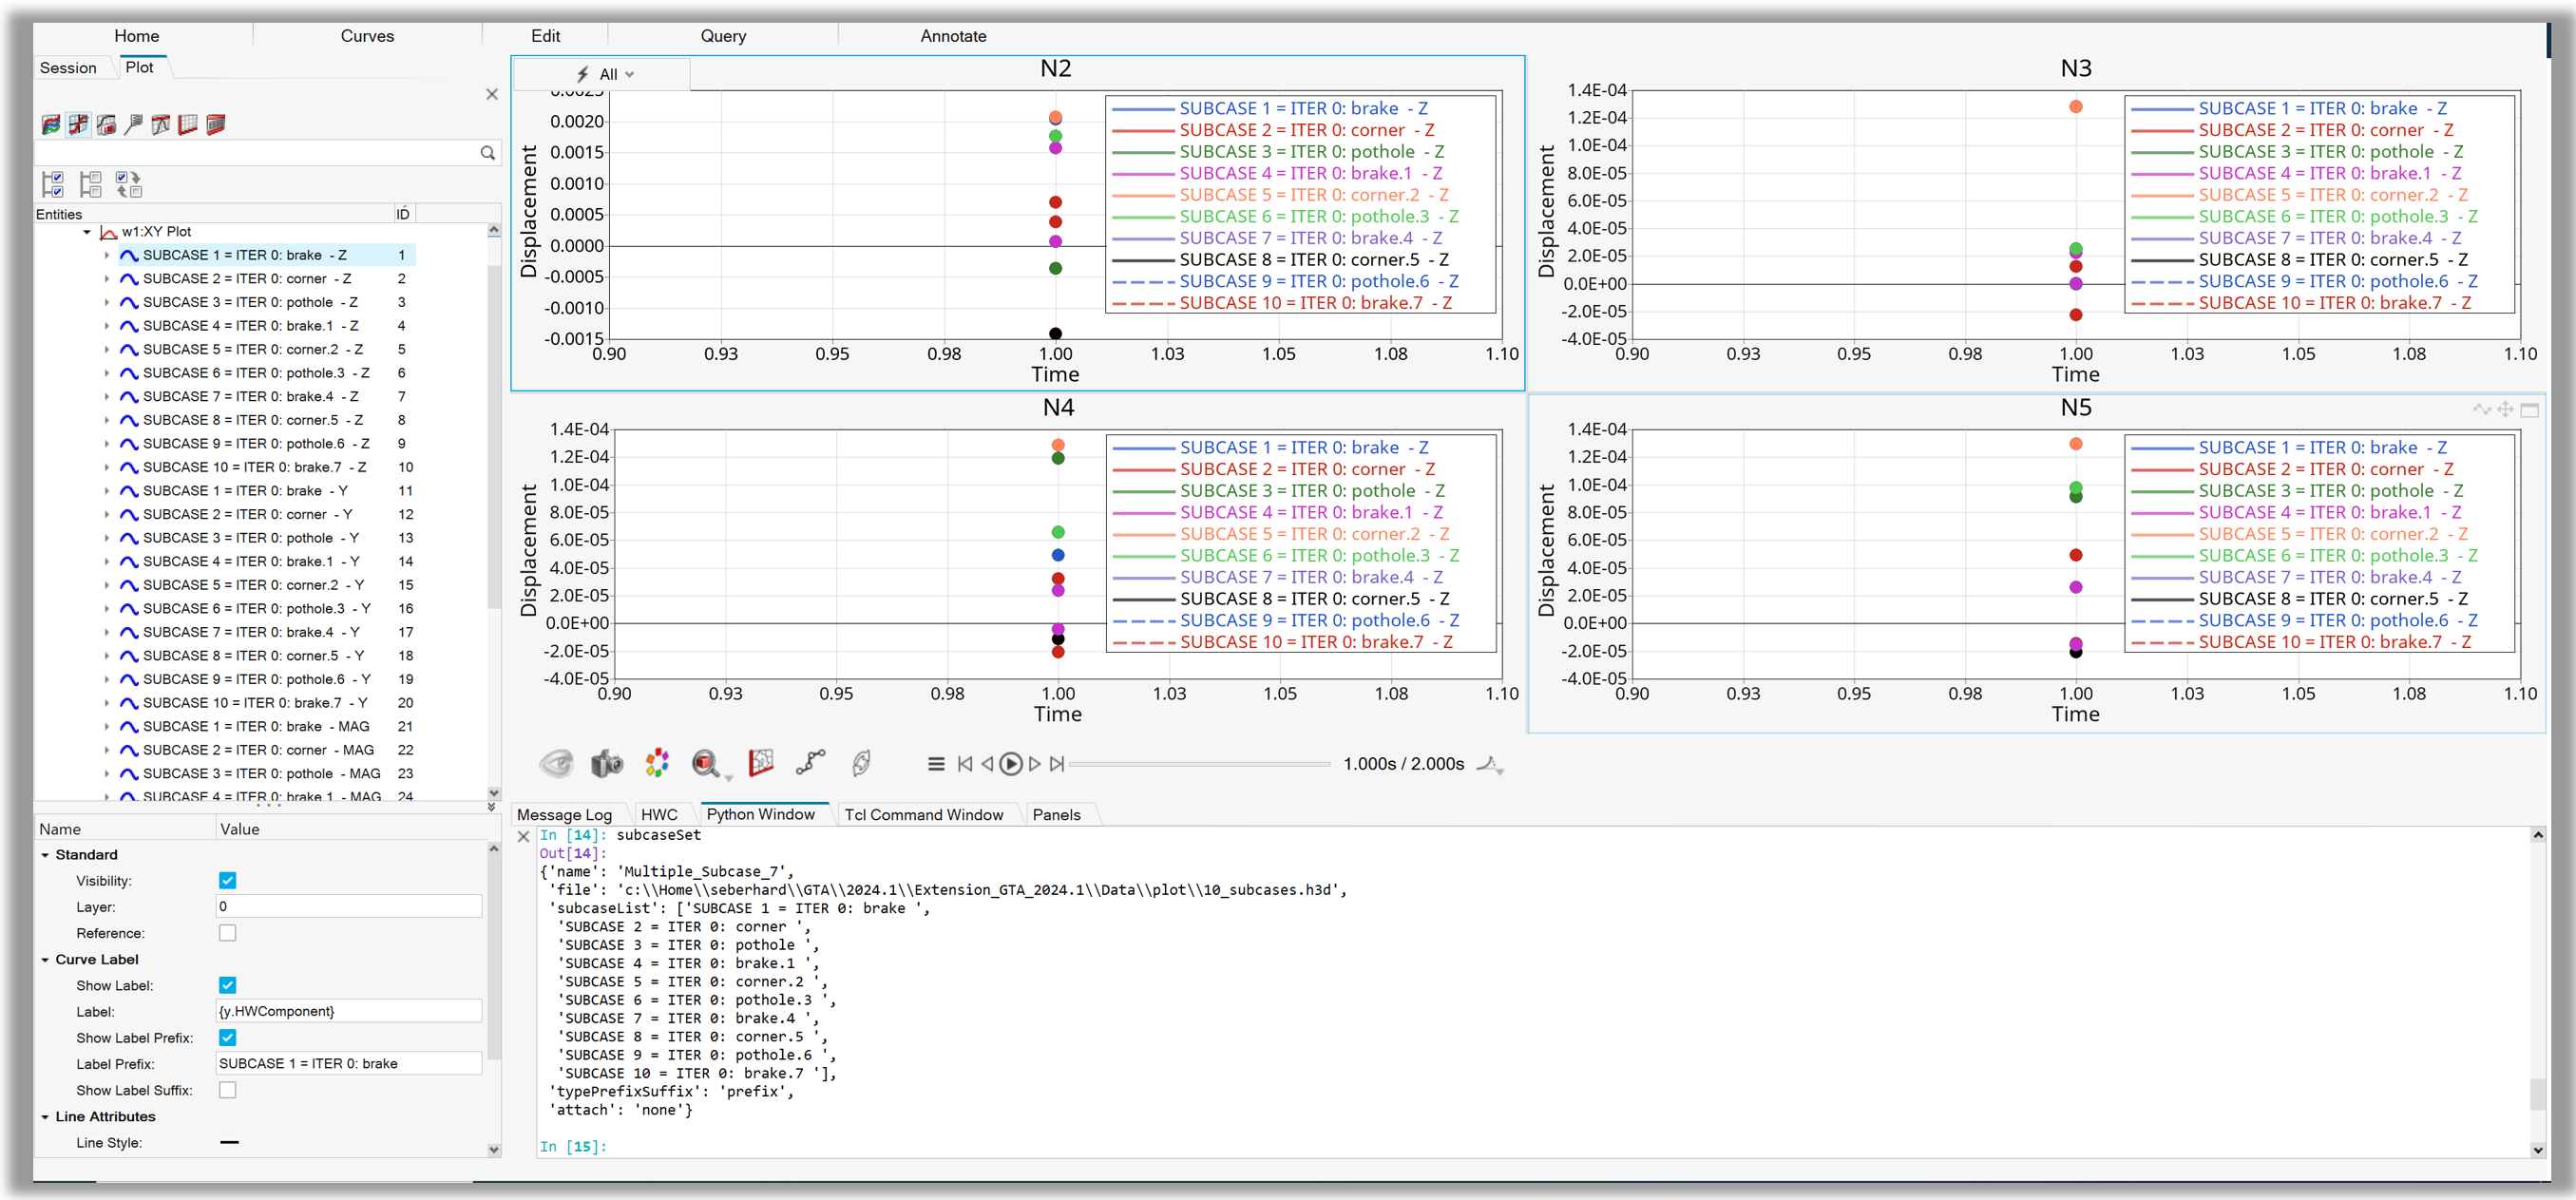
Figure 4. Plotting Curves from Multiple Subcases
Example 05 - Create XY Curve Plot Options#
By using the CreateCurvesOptions class the user can set all plot options similar to the “Create Curves by File” - “Plot Options” tab.
From page attributes like pageFont, pageTitle , head/footer attributes like headerVisibility , headerText, to curve math attributes like curveUseMath and curveXexpression. Options like layoutType or layoutOrganisation can be set on the CreateCurvesByFile.
 1import hw
 2import hw.hg as hg
 3import os
 4
 5ALTAIR_HOME = os.path.abspath(os.environ['ALTAIR_HOME'])
 6plotFile   = os.path.join(ALTAIR_HOME,'demos','mv_hv_hg','plotting','madymo','ANGACC')
 7
 8
 9ses = hw.Session()
10ses.new()
11win = ses.get(hw.Window)
12
13df = hg.DataFile(plotFile)
14subcaseList = df.getSubcaseLabels()
15df = hg.DataFile(plotFile)
16dtl = df.getDataTypes()
17dataType = dtl[1]
18
19createCurvesOptions = hg.CreateCurvesOptions('MyCurveOptions')
20
21createCurvesOptions.pagePublishTitle = True
22font = createCurvesOptions.pageFont
23font.size = 20
24font.family = 'Arial'
25createCurvesOptions.pageFont = font
26createCurvesOptions.pageTitleScheme = 'custom'
27createCurvesOptions.pageTitle = 'My Page'
28
29createCurvesOptions.headerVisibility = True
30createCurvesOptions.headerLabelScheme = 'custom'
31createCurvesOptions.headerText = '{y.HWRequest} - {y.HWComponent} modified'
32createCurvesOptions.headerPrimaryFontSize = 16
33createCurvesOptions.headerAlignment = 'right'
34
35createCurvesOptions.footerVisibility = True
36createCurvesOptions.footerLabelScheme = 'custom'
37createCurvesOptions.footerText = '{y.HWRequest} - {y.HWComponent} modified'
38createCurvesOptions.footerPrimaryFontSize = 16
39createCurvesOptions.footerAlignment = 'right'
40
41createCurvesOptions.legendFontSize = 8
42createCurvesOptions.legendPlacement = 'insidelefttop'
43createCurvesOptions.legendVisibility = True
44
45createCurvesOptions.curveUseMath = True
46createCurvesOptions.curveXexpression = 'u*5'
47createCurvesOptions.curveYexpression = 'v*10'
48createCurvesOptions.curveShowLabel = True
49createCurvesOptions.curveLabelScheme = 'custom'
50createCurvesOptions.curveLabel = '{y.HWRequest} - edited - {y.HWComponent}'
51createCurvesOptions.curveShowLabelPrefix = True
52createCurvesOptions.curveLabelPrefix = 'START'
53createCurvesOptions.curveShowLabelSuffix = True
54createCurvesOptions.curveLabelSuffix = 'STOP'
55
56createCurvesOptions.curveLineColorScheme = 'allOneColor'
57
58col = hw.Color(rgb=(0,255,0))
59createCurvesOptions.curveLineColor = col
60createCurvesOptions.curveLineThicknessScheme = 'allOneThickness'
61createCurvesOptions.curveLineThickness = 3
62createCurvesOptions.curveLineStyleScheme = 'allOneStyle'
63createCurvesOptions.curveLineStyle = 4
64createCurvesOptions.curveSymbolScheme = 'allOneSymbol'
65createCurvesOptions.curveSymbol = 5
66createCurvesOptions.curveSymbolStyle = 3
67createCurvesOptions.curveSymbolColor = col
68createCurvesOptions.curveSymbolFrequency = 10
69
70createCurvesOptions.curveXscale = 3
71createCurvesOptions.curveXoffset = 1000
72
73createCurvesOptions.curveYscale = 7
74createCurvesOptions.curveYoffset = 5000
75
76createCurvesOptions.curveStartIndex = 10
77createCurvesOptions.curveEndIndex = 100
78createCurvesOptions.curveIndexIncrement = 10
79
80# --------------------------------------------------
81
82createCurves = hg.CreateCurvesByFile()
83createCurves.file  =  plotFile
84createCurves.curveOptionsEnabled = True
85createCurves.curveOptions = createCurvesOptions
86createCurves.yDataType = dataType
87createCurves.yRequest = 'all'
88createCurves.yComponent = 'all'
89createCurves.layoutType = 1
90createCurves.layoutOrganisation = 'onePlotPerRequest'
91
92createCurves.run()
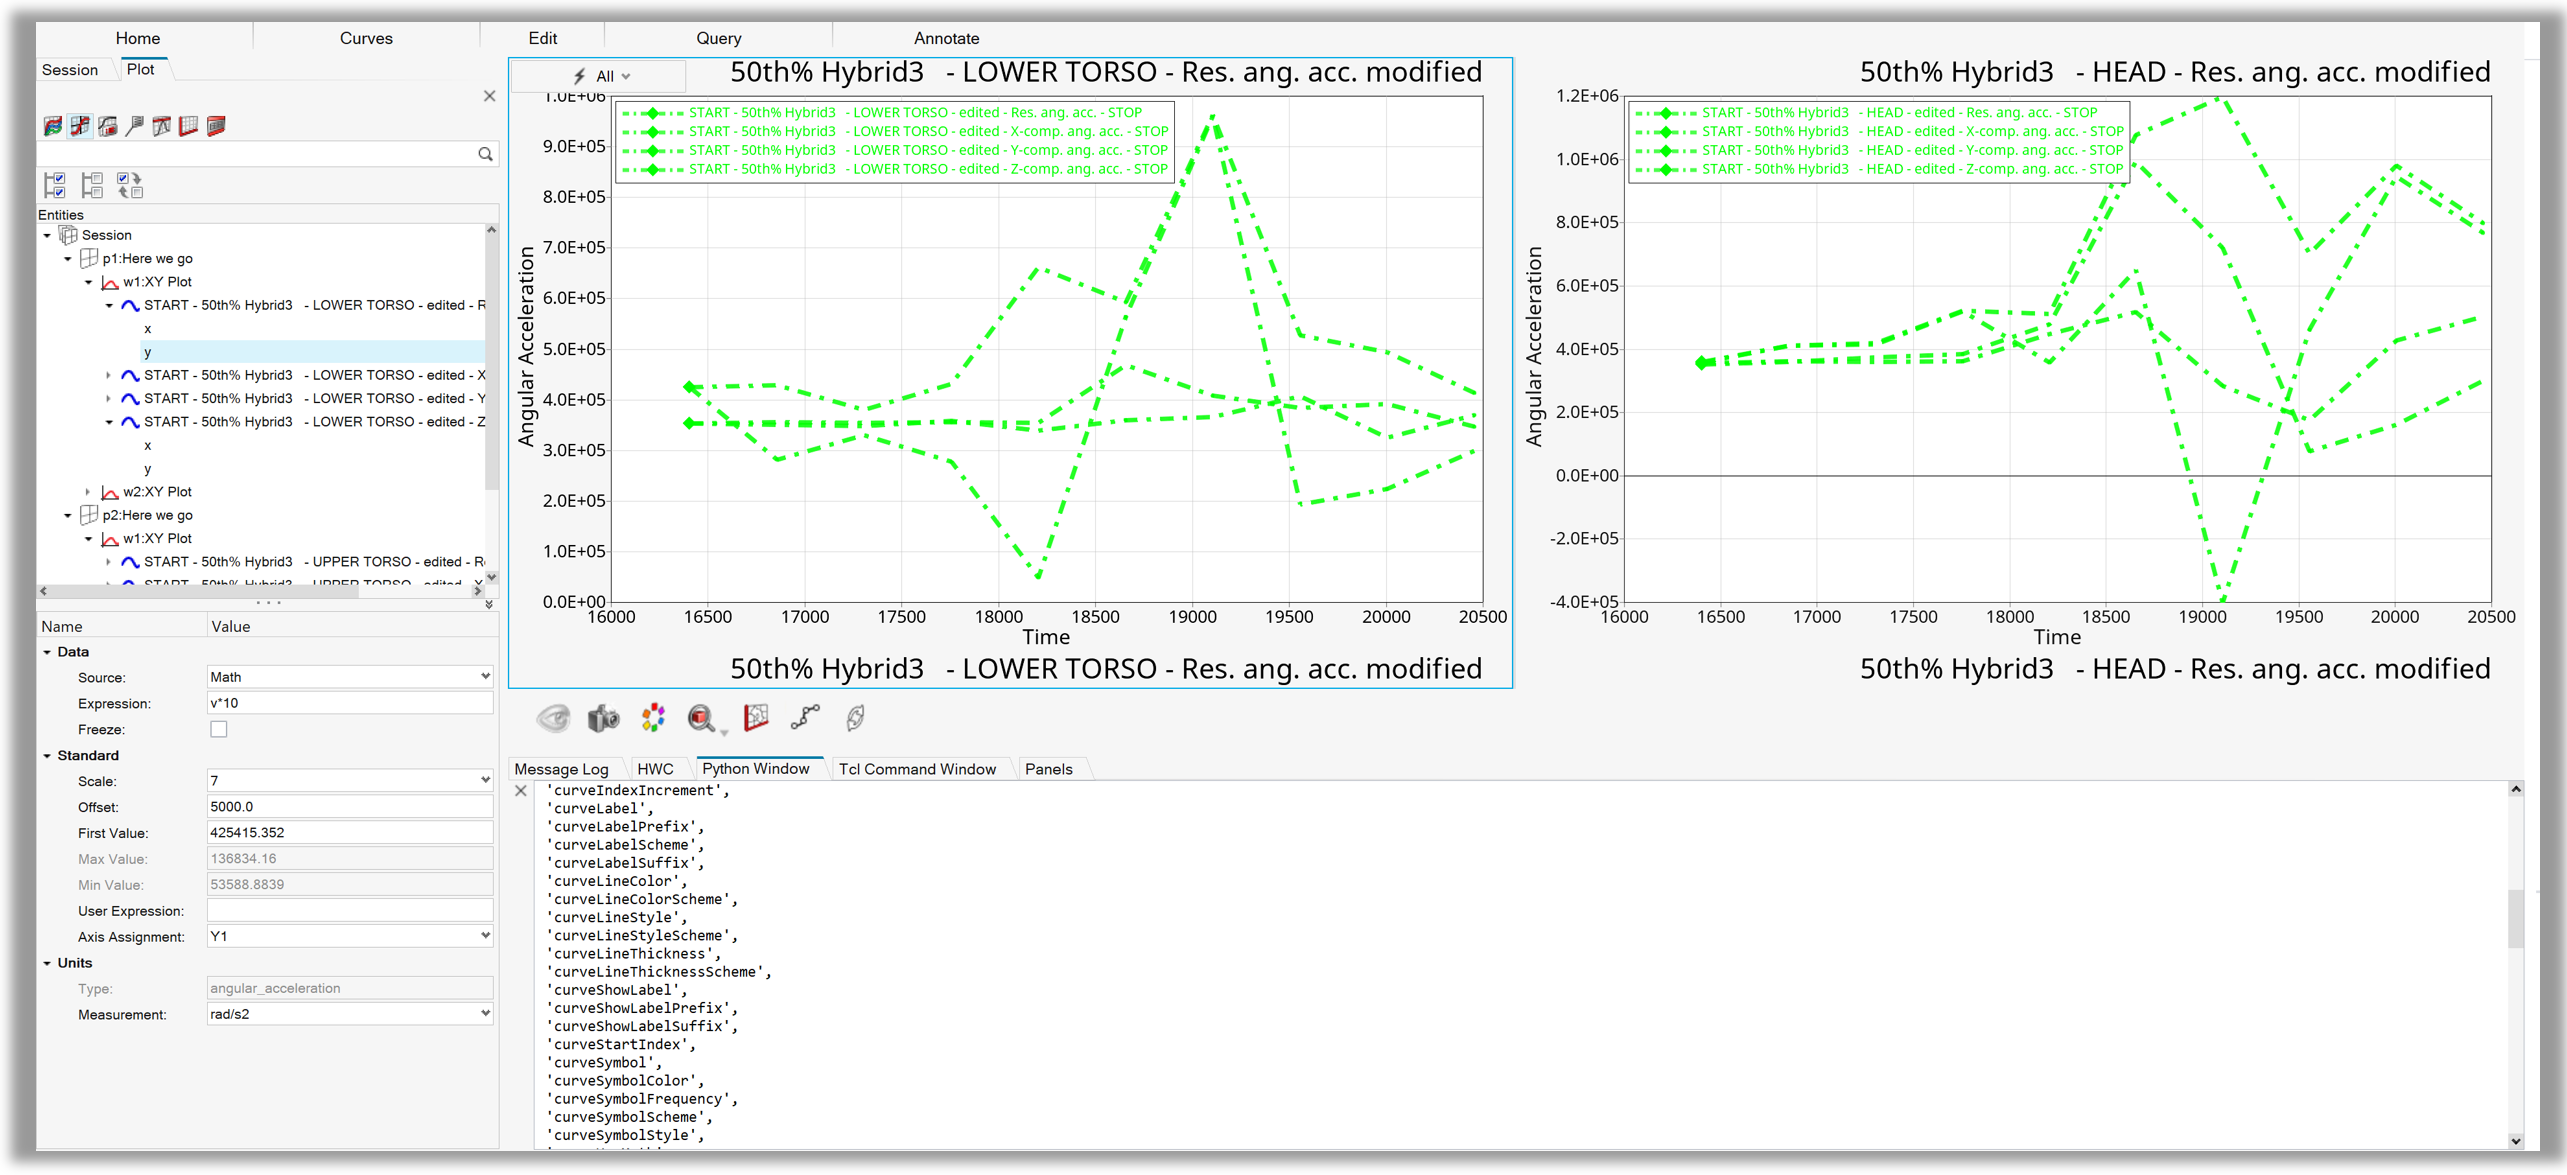
Figure 5. Plotting XY curvesw with modified Create Curves settings
Example 06 - Create multiple Complex Plots#
This example covers the creation of multiple complex plots using the CreateCurvesByFile with the attribute chartType = “complex”.
In the first step the DataFile class extracts the header channel information like the data type list, the request and component list from a given complex plot file. Key is that the component list is extracted using the method getComponents().
Using the CreateCurvesByFile class in the second step allows to plot multiple pages and windows similar to the functionality available in the “Create curves by file” GUI.
This class are given as attributes the data file, a single data type and request and component lists from the first step as plot channel definitions.
The attribute layoutType = 7 defines three complex plots side by side, the attribute layoutOrganisation = “onePlotPerComponent” plots each component in a single plot.
 1import hw
 2import hw.hg as hg
 3import os
 4
 5scriptDir = os.path.abspath(os.path.dirname(__file__))
 6plotFile = os.path.join(scriptDir,'plot','control_arm_sol111.pch').replace("\\","/")
 7
 8ses  = hw.Session()
 9ses.new()
10win=ses.get(hw.Window)
11
12dtIndex = 1
13dataFile = hg.DataFile(plotFile)
14scl = dataFile.getSubcaseLabels()
15dtl = dataFile.getDataTypes()
16rl = dataFile.getRequests(dtl[dtIndex])
17
18cl = dataFile.getComponents(dtl[dtIndex],format='complex')
19dt = dtl[1]
20sc = scl[0]
21
22win.type="complex"
23createCurves = hg.CreateCurvesByFile()
24createCurves.file = plotFile
25createCurves.chartType = 'complex'
26createCurves.subcase = sc
27createCurves.yDataType = dt
28createCurves.yRequest = rl
29createCurves.yComponent = cl[2:]
30createCurves.layoutType = 7
31createCurves.layoutOrganisation = 'onePlotPerComponent'
32print('Component List = ' + str(createCurves.yComponent))
33
34createCurves.run()
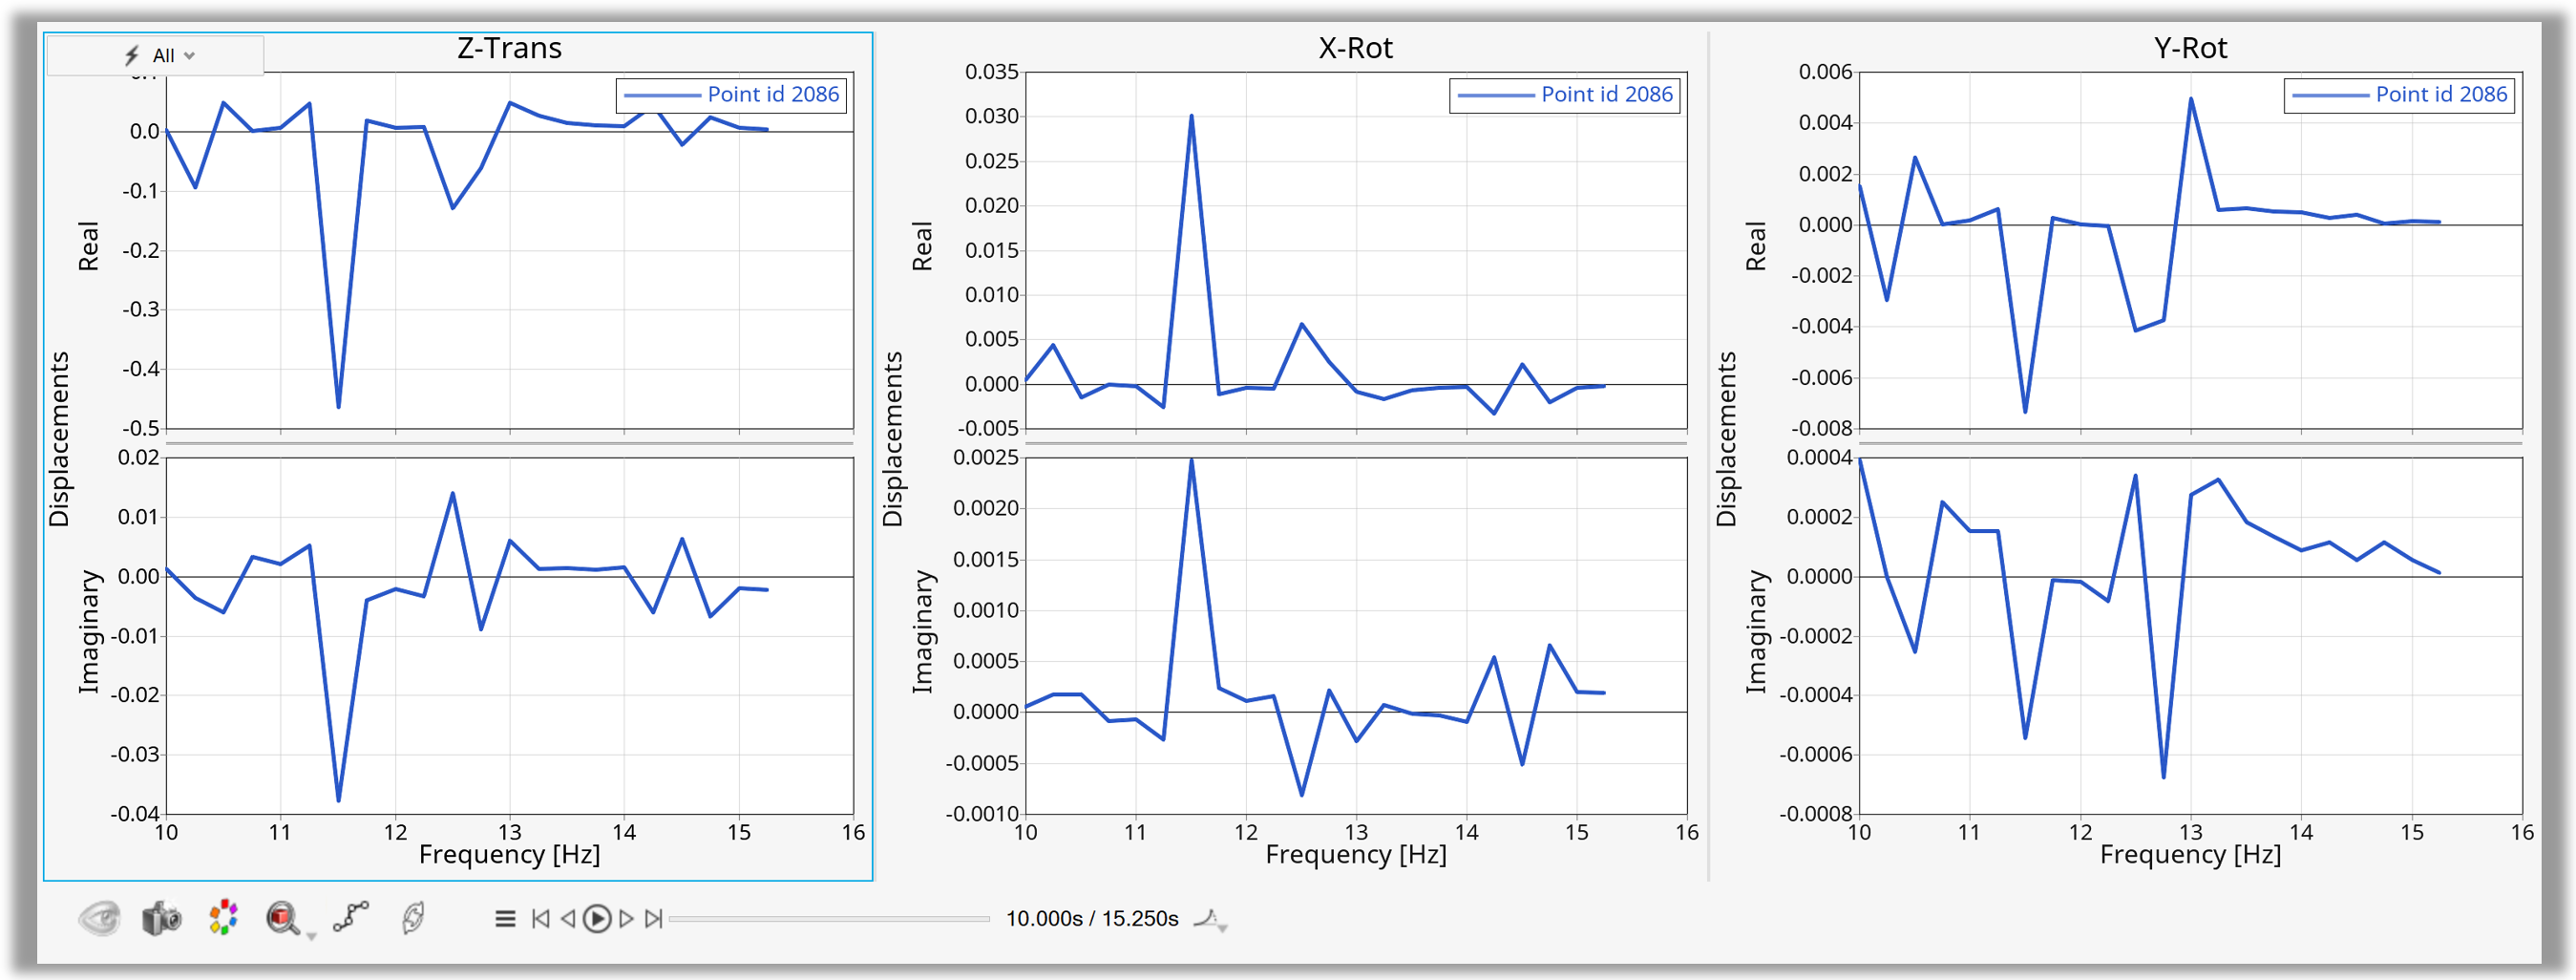
Figure 6. Create multiple complex plots in a predefined layout
Example 07 - Create multiple Polar Plots#
The following code creates multiple polar plots using the CreateCurvesByFile with the attribute chartType = “polar”.
In the first step the DataFile class extracts the header channel information like the data type list, the request and component list from a given complex plot file. Key is that the component list is extracted using the method getComponents().
Using the CreateCurvesByFile class in the second step allows to plot multiple pages and windows similar to the functionality available in the “Create curves by file” GUI.
This class are given as attributes the data file, a single data type and request and component lists from the first step as plot channel definitions.
The attribute layoutType = 7 defines three polar plots side by side, the attribute layoutOrganisation = “onePlotPerComponent” plots each component in a single plot.
 1import hw
 2import hw.hg as hg
 3import os
 4
 5scriptDir = os.path.abspath(os.path.dirname(__file__))
 6plotFile = os.path.join(scriptDir,'plot','control_arm_sol111.pch').replace("\\","/")
 7
 8ses  = hw.Session()
 9ses.new()
10win=ses.get(hw.Window)
11
12dtIndex = 1
13dataFile = hg.DataFile(plotFile)
14scl = dataFile.getSubcaseLabels()
15dtl = dataFile.getDataTypes()
16rl = dataFile.getRequests(dtl[dtIndex])
17
18cl = dataFile.getComponents(dtl[dtIndex],format='polar')
19dt = dtl[1]
20sc = scl[0]
21
22createCurves = hg.CreateCurvesByFile()
23createCurves.file = plotFile
24createCurves.chartType = 'polar'
25createCurves.subcase = sc
26createCurves.yDataType = dt
27createCurves.yRequest = rl
28createCurves.yComponent = 'all'
29createCurves.layoutType = 7
30createCurves.layoutOrganisation = 'onePlotPerComponent'
31print('Component List = ' + str(createCurves.yComponent))
32
33createCurves.run()
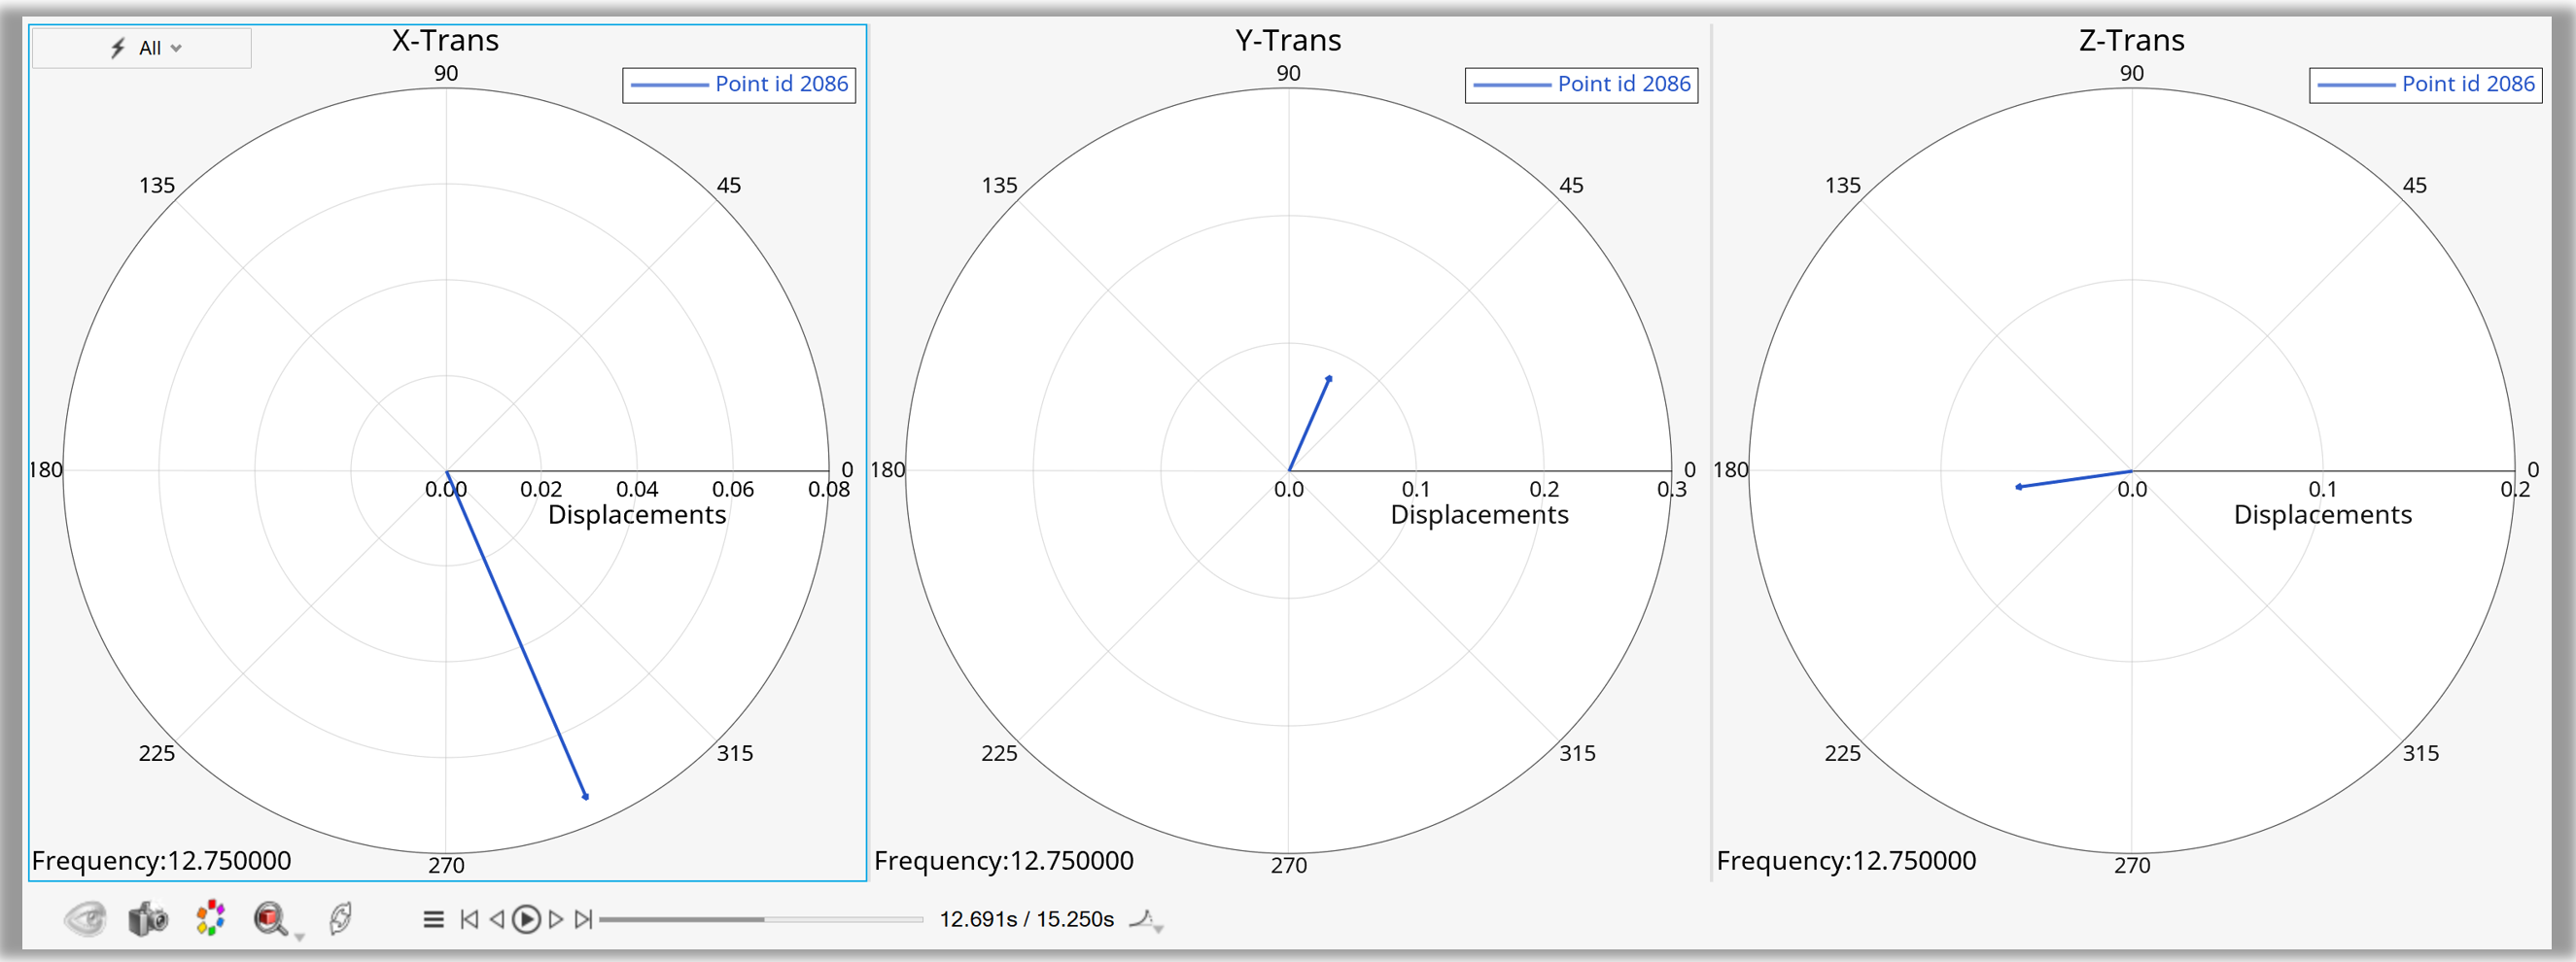
Figure 7. Create multiple polar plots in a predefined layout