Math and Annotations#
Some examples require external input files. Before you start, please follow the link in the Example Scripts section to download the zip file with model and result files.
Example 01 - Curves from Files, Datums, Notes, Legends and PNG, XYDATA Export#
The code loads two curves in an XY plot using the CurveXY class, applies SAE filtering and vertical trimming.
Two notes are added by the Note class, dynamically positioned at the maximum of the curves using a Templex expression to get the index of the curve maximum.
In addition, two vertical datum lines are added by the DatumVertical class, positioned similar to the notes at the maximum of the curves using a Templex expression.
The area between the two curves is shaded using the curve attribute shadeStyle = “betweenCurves” on the second curve.
Finally, a JPEG image in a given width and height is exported using the CaptureImageTool class, in addition with a xy data ascii file containing the curve values via the ExportCurves class.
 1import hw
 2import hw.hg as hg
 3import os
 4
 5ALTAIR_HOME = os.path.abspath(os.environ["ALTAIR_HOME"])
 6plotFile = os.path.join(
 7    ALTAIR_HOME, "demos", "mv_hv_hg", "plotting", "madymo", "ANGACC"
 8)
 9pngFile = os.path.join(
10    os.path.abspath(os.path.dirname(__file__)), "HG_Image_Export.png"
11)
12xyDataFile = os.path.join(
13    os.path.abspath(os.path.dirname(__file__)), "HG_Curve_Export.xydata"
14)
15
16# New session
17ses = hw.Session()
18ses.new()
19win = ses.get(hw.Window)
20win.type = "plot"
21
22# Define image and curve export tools
23captureImage = hw.CaptureImageTool(
24    file=pngFile,
25    type="png",
26    width=2000,
27    height=1000,
28)
29exportCurves = hg.ExportCurves(file=xyDataFile, format="xyData", range="all")
30
31# Layout and channel settings
32colorList = [(255, 0, 0), (0, 0, 255)]
33requestList = ["50th% Hybrid3   - LOWER TORSO", "50th% Hybrid3   - UPPER TORSO"]
34autoPosList = ["right", "left"]
35
36# Loop over curves, notes and datums
37for color, request, autoPos in zip(colorList, requestList, autoPosList):
38
39    # Add curves
40    cu = hg.CurveXY(
41        xFile=plotFile,
42        xSource="file",
43        xDataType="Time",
44        xRequest="Time",
45        xComponent="Time",
46        yFile=plotFile,
47        ySource="file",
48        yDataType="Angular Acceleration",
49        yRequest=request,
50        yComponent="Res. ang. acc.",
51        lineColor=color,
52        label="{y.HWRequest} - {y.HWComponent}",
53    )
54
55    # Add curve math
56    cu.mathAdd("SAE", padding=1, direction=1, filterClass=15)
57    cu.mathAdd("trim", start=20, end=130)
58
59    cuId = str(cu.id)
60
61    # Add note attached to curve math
62    no = hg.Note(
63        attachTo="curve",
64        attachmentCurve=cu.id,
65        attachmentPoint=f'indexofmax(c{cuId}.y)',
66        text="Max = {y} at {x}",
67        autoPosition=True,
68        autoPositionStrategy=autoPos,
69        curveColor=True,
70    )
71
72    # Add vertical datum
73    dv = hg.DatumVertical(
74        position=f'c{cuId}.x[indexofmax(c{cuId}.y)]',
75        label="Max " + cu.yRequest,
76        labelLocation="upperCenter",
77        lineColor=color,
78    )
79
80# Modify legend
81legend = ses.get(hg.Legend)
82legFont = hw.Font(size=14)
83legend.placement = "insideRightBottomCorner"
84legend.font = legFont
85
86# Shade area between 2 curves
87cu.setAttributes(
88    shadeArea=True,
89    shadeStyle="betweenCurves",
90    shadeSecondCurve=1,
91    shadeColor="Blue",
92    shadeAlpha=0.2,
93)
94
95win.update()
96
97# Export image and modified curve values in XYDATA format
98captureImage.capture()
99exportCurves.export()
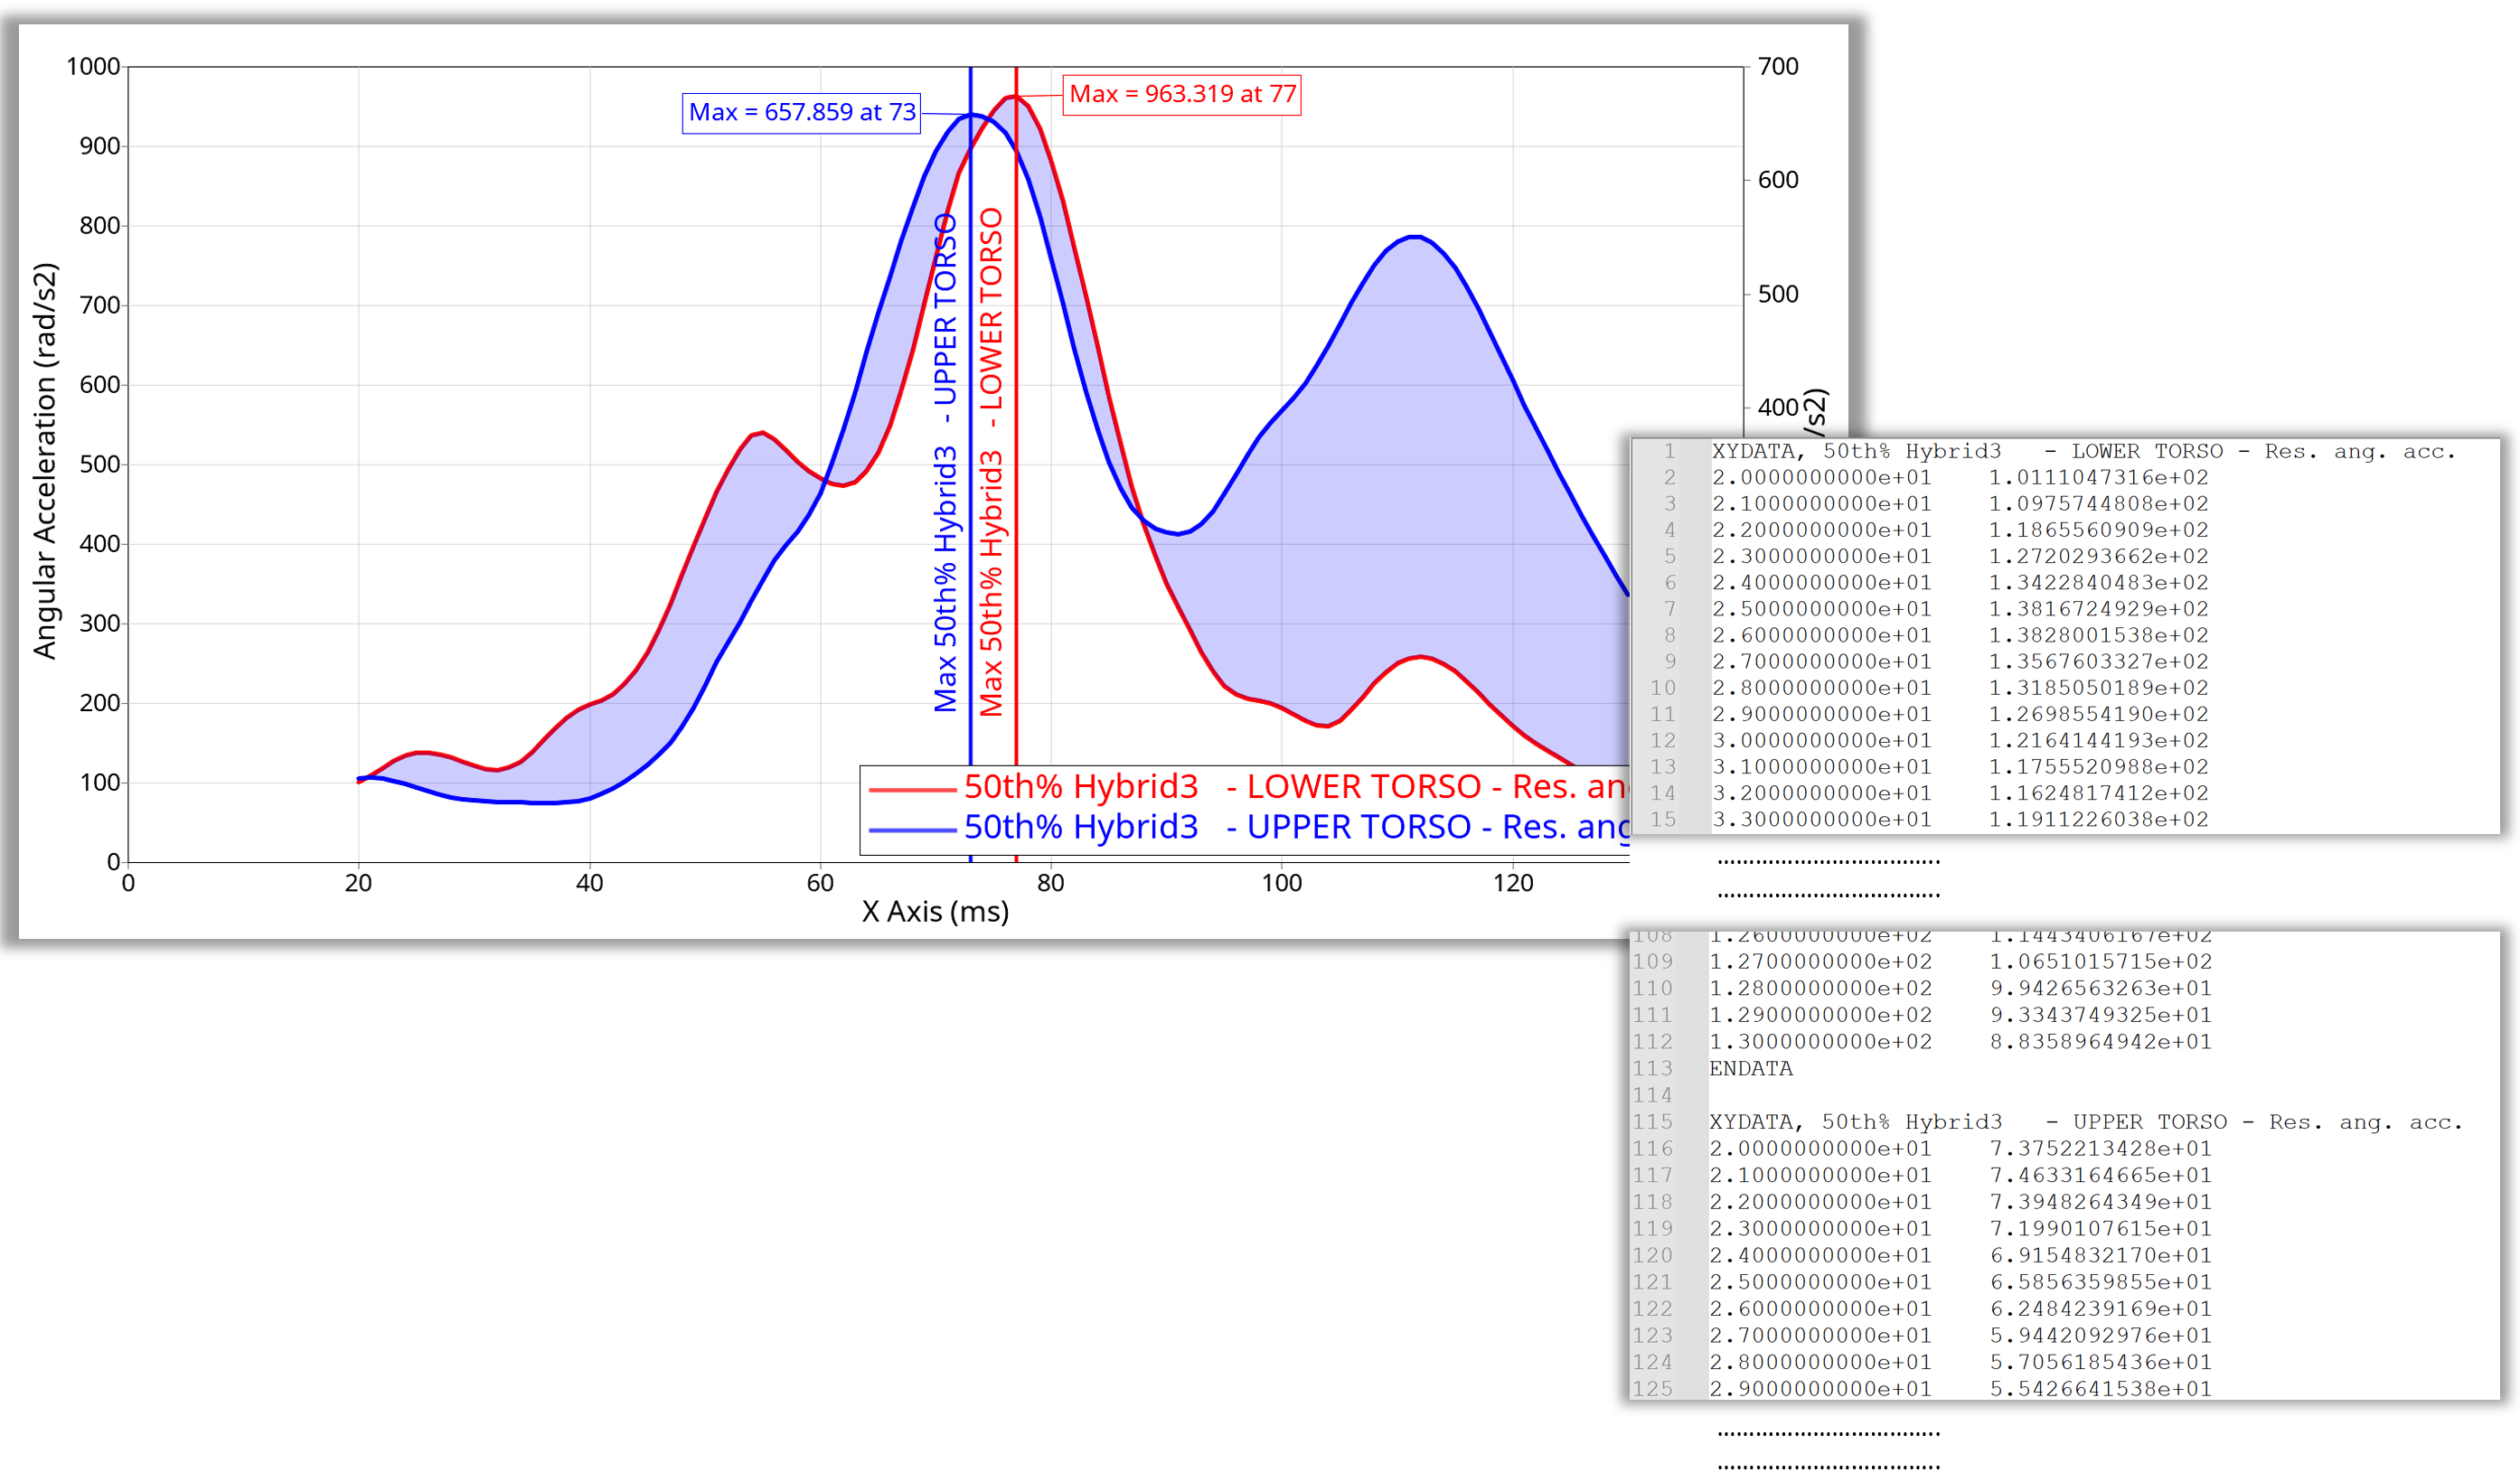
Figure 1. Exported Image of script ‘Curves from Files, Datums, Notes, Legends and PNG, XYDATA Export’
Example 02 - evalHWC() for Curve Import and Math Operations#
The main focus of this example is to execute slightly modified recorded HWC commands using the the evalHWC() wrapper class in Python.
The script executes the following steps:
Starting a new session and switching to HyperGraph
Plotting two curves using the “Create Curves by File” GUI in a two window side-by-side layout
Applying Stackmath operations for “trim”, “SAE” and “resample” to all curves in all windows
 1import hw
 2import hw.hg as hg
 3import os
 4
 5ALTAIR_HOME = os.path.abspath(os.environ["ALTAIR_HOME"])
 6plotFile = os.path.join(
 7    ALTAIR_HOME, "demos", "mv_hv_hg", "plotting", "madymo", "ANGACC"
 8).replace('\\','/')
 9
10# New session
11hw.evalHWC("delete session")
12# Set Client Type to HyperGraph
13hw.evalHWC('hwd window type="HyperGraph 2D"')
14# Load curves with build plots module
15hw.evalHWC("xy option layout destination=oneplotperrequest")
16hw.evalHWC("xy option layout layout=1")
17hw.evalHWC(
18    f'xy load file="{plotFile}" ydatatype= "Angular Acceleration" \
19    yrequest= "50th% Hybrid3   - LOWER TORSO" , "50th% Hybrid3   - UPPER TORSO" ycomponent= all'
20)
21hw.evalHWC(
22    'xy curve stackadd range="w:all i:all" operation=trim start=20 end=130 interpolate=false'
23)
24# Add curve math for all curves in current plot
25hw.evalHWC(
26    'xy curve stackadd range="w:all i:all" operation=SAE padding=1 samples=10 direction=3 filterClass=60'
27)
28hw.evalHWC(
29    'xy curve stackadd range="w:all i:all" operation=resample type="Resample Fixed Points" fixnum=100.0'
30)
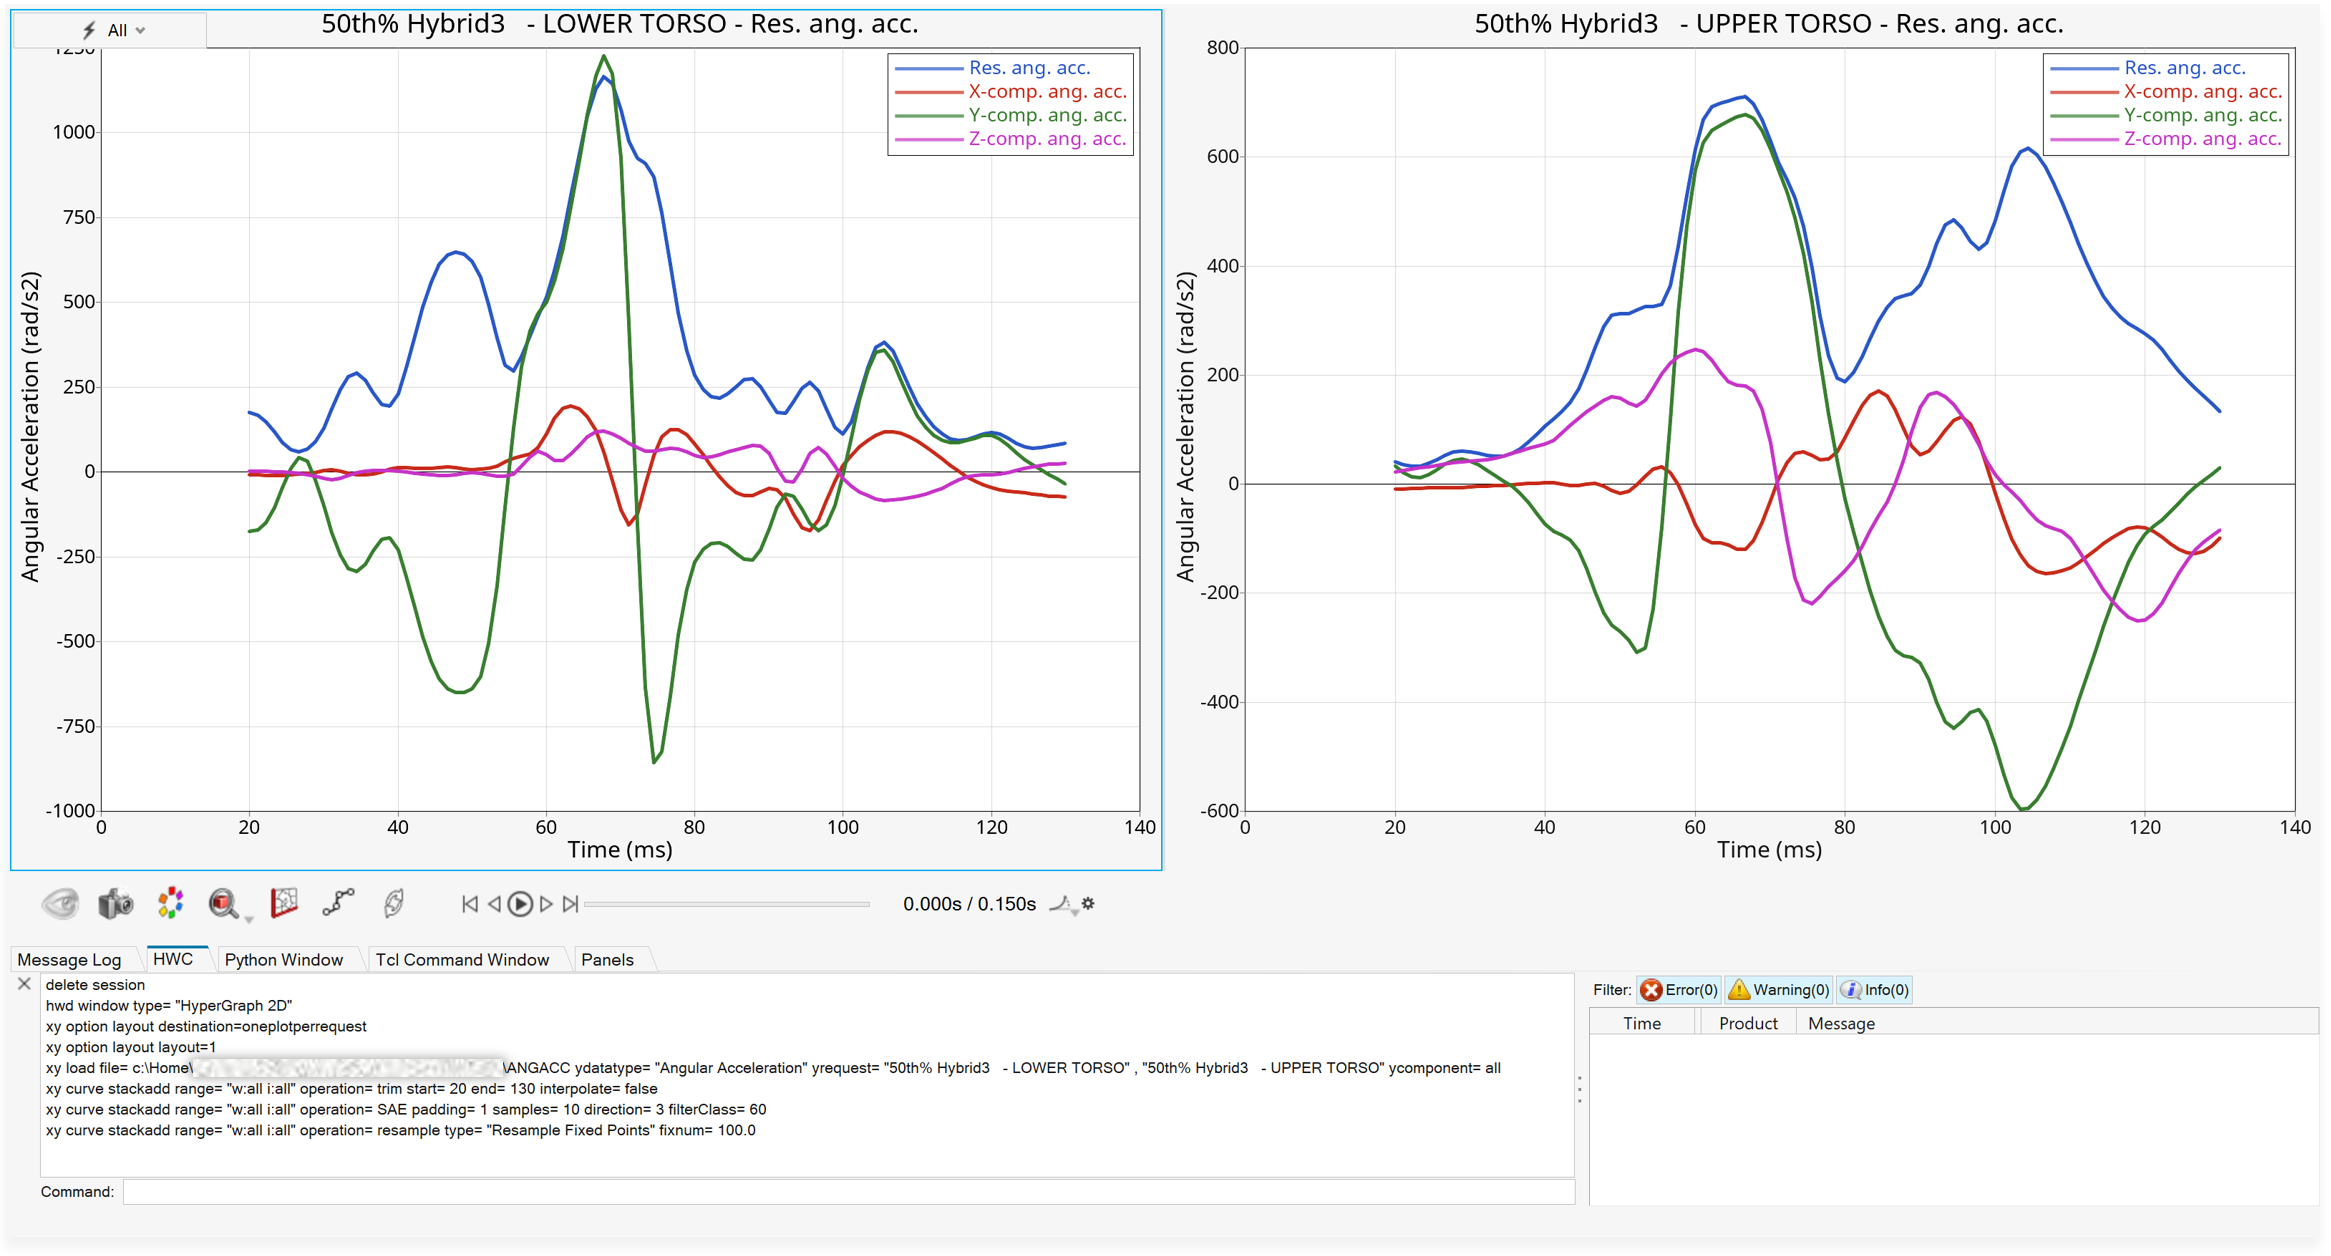
Figure 2. Output of ‘evalHWC() for Curve Import and Math Operations’