The Results Visualization tab contains two sections: Interior Noise Levels
Plotting and dBMaps Visualization.Figure 1.
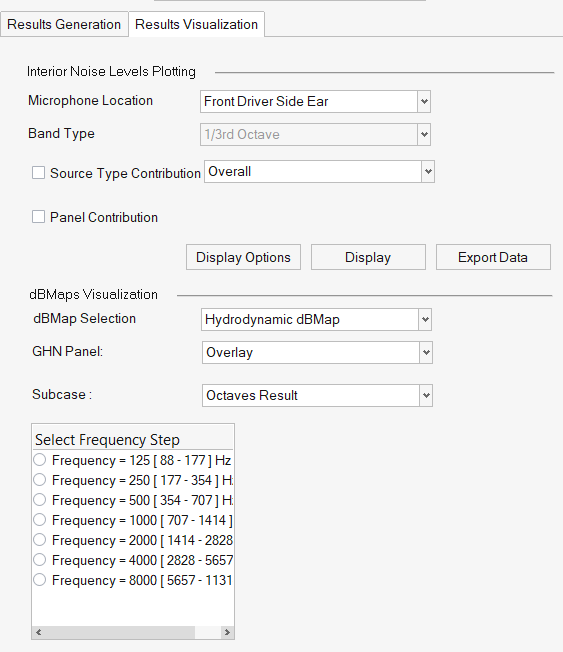
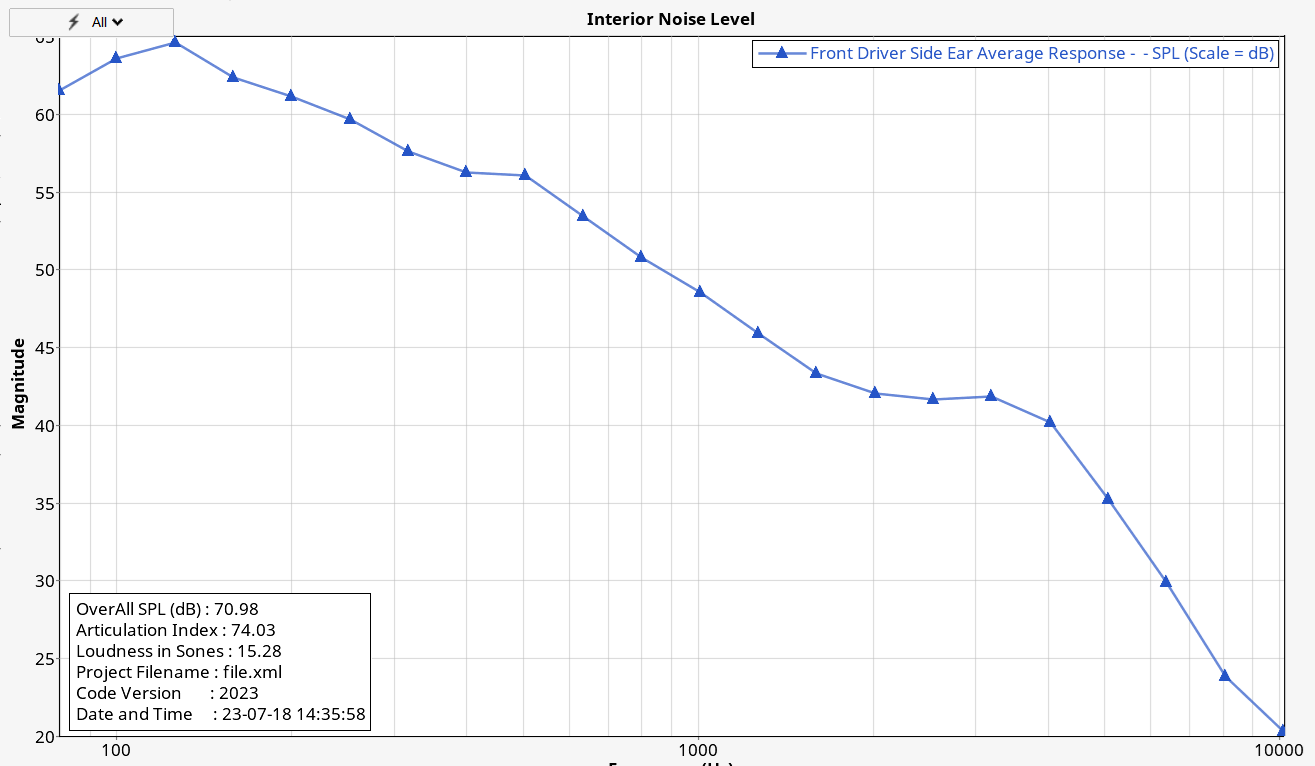
Interior Noise Level Plotting
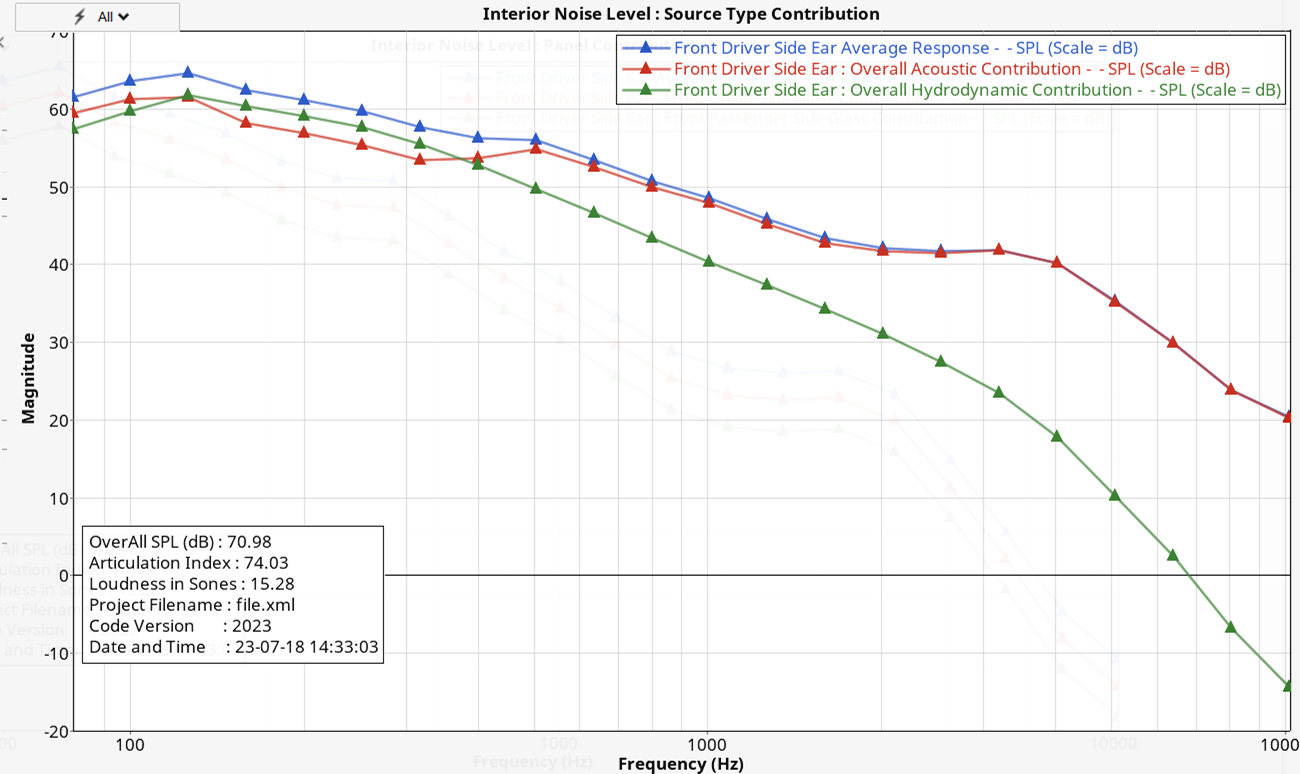
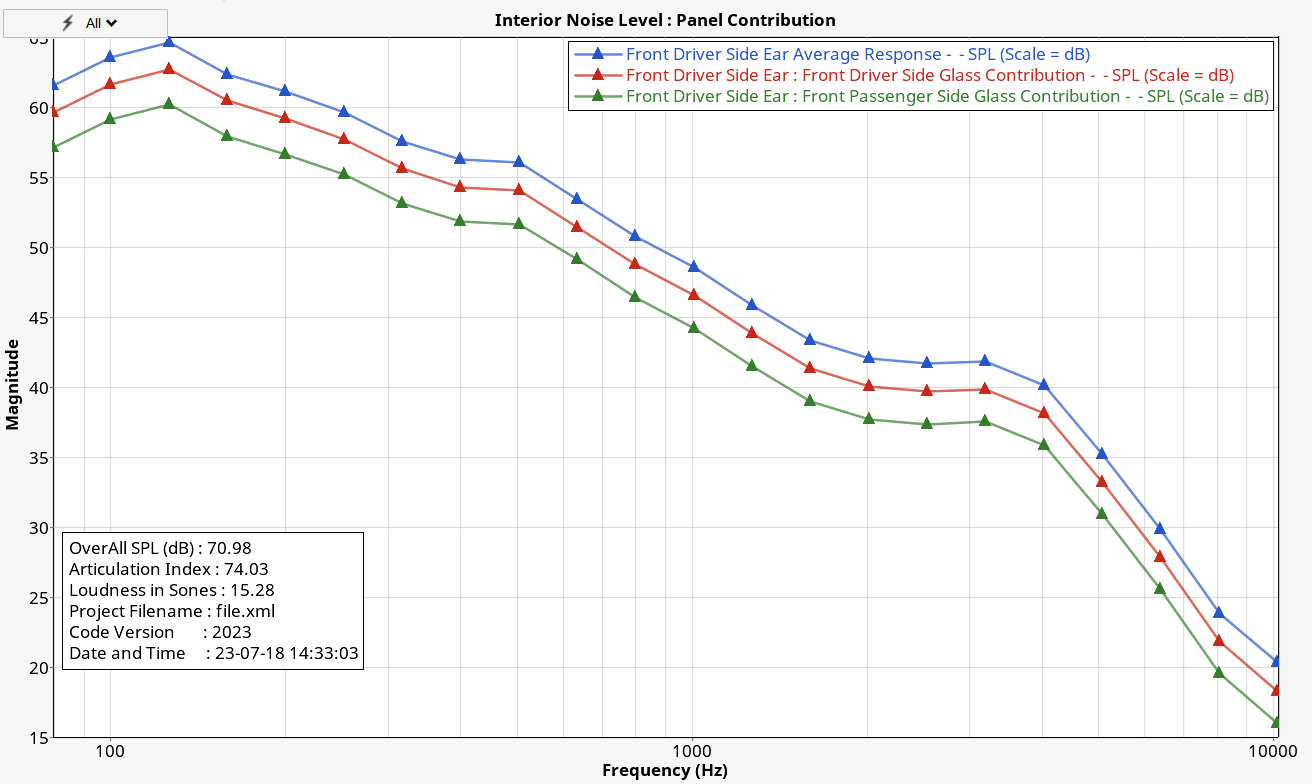
From this section, select the microphone location and type of output
required, like source and panel type contribution.
Click Display Options to customize the
output.
Click Export Data to export the contribution data
to a file. Use a right-click context menu to convert an interior noise
curve to an audio file. Figure 2. Figure 3. Figure 4.
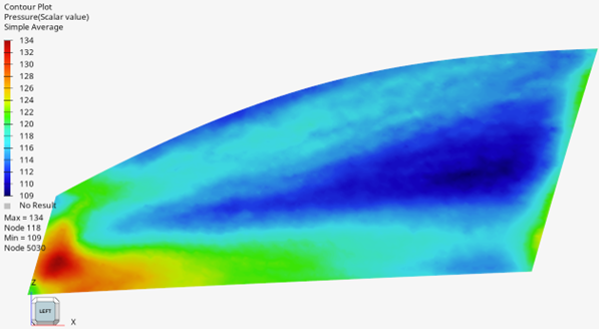
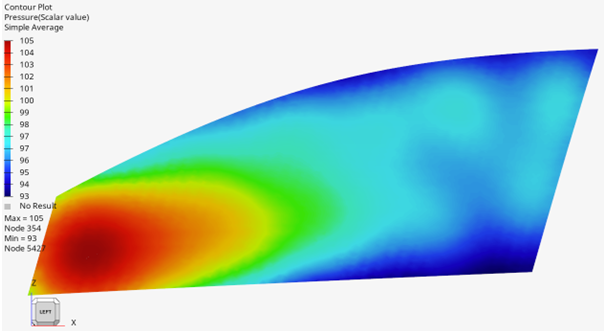
dBMap Visualization
From this section, you can visualize the acoustic and hydrodynamic dBMap
of the panel selected during the result generation.
Additionally, choose the band type and frequency band for the dBMap.
Figure 5. Hydrodynamic dBMap Figure 6. Acoustic dBMap