Multi-GPU Scaling

Simulation Setup

  • FZG case (Technical University of Munich)
  • Single phase
  • dx = 0.3 mm →≈ 50 million particles
  • 2180 RPM
  • 1 MPI process for each GPU
  • OpenMPI CUDA-aware library (shipped with nanoFluidX)
Simulations ran for equal number of time steps, therefore limiting the physical time simulated by each case and emphasizing the realistic difference in performance 
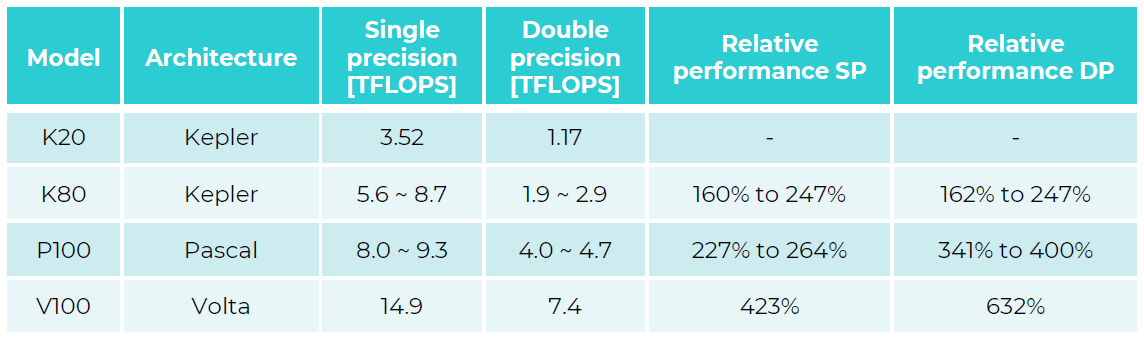
between different hardware configurations.


Figure 1. Official performance numbers by NVIDIA

Systems

K20
GPU scaling solution
Dual socket Intel® Xeon® CPU E5 2630 v2 @ 2.60GHz (12 cores)
Two NVIDIA TESLA K20, one for each socket
Two Mellanox Connect IB FDR, one for each socket
K80
Dense GPU solution
Dual socket Intel® Xeon® CPU E5 2670 v3 @ 2.30GHz (24 cores)
Four NVIDIA TESLA K80, attached to each socket as pair of two
No IB considered
P100+FDR
Balanced intra-node/inter-node GPU solution
Single socket Intel® Xeon® CPU E5 2650 v4 @ 2.20GHz (12 cores)
Four NVIDIA TESLA P100 16 GByte PCIe, all attached via PLX single socket
Single Mellanox Connect IB FDR, one for each socket (upgrading to EDR)
Note: Cambridge studies used nanoFluidX 2.09
NVIDIA DGX-2
Dual socket Intel® Xeon® Platinum 8168 CPU @ 7 0GHz (48 cores total)
16x NVIDIA ® Tesla V100
Note: Using nanoFluidX 2019.1.1

Results

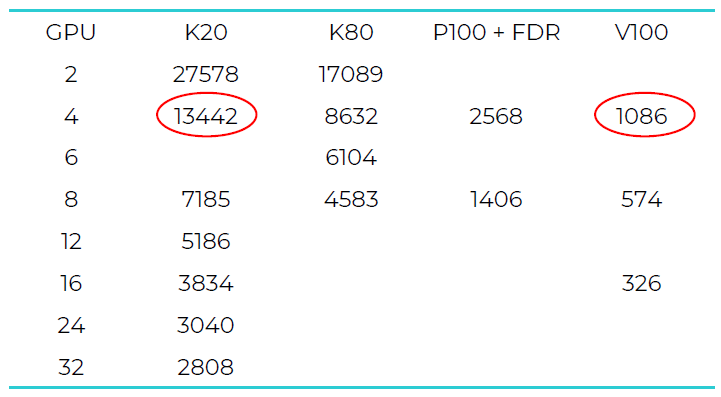
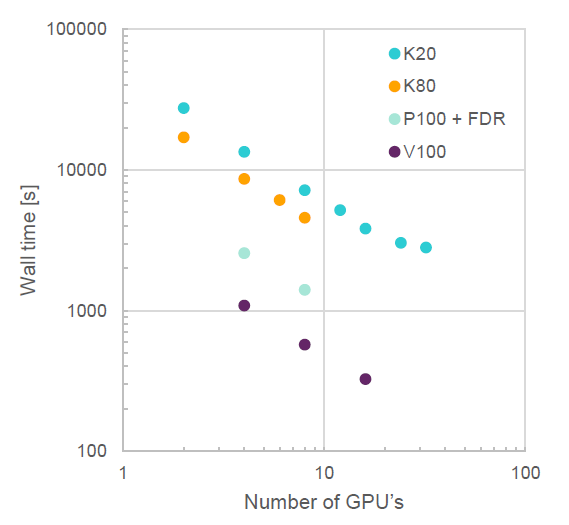
Excellent scaling is observed in all cases.


Figure 2. Wall time of the simulation (s). Circled numbers indicate 12.4 times faster performance
Figure 3.


Conclusions

Scaling is demonstrated for all four GPU models (K20, K80, P100 and V100), despite having limited number of test points for P100 and V100 cards. Strong scaling efficiency is dependent on the size of the case, implying a sufficient computational load per GPU in order to maintain scaling efficiency. For nanoFluidX, this has been observed to be more than two million particles per GPU.