Experimental Validation - PIV Experiments
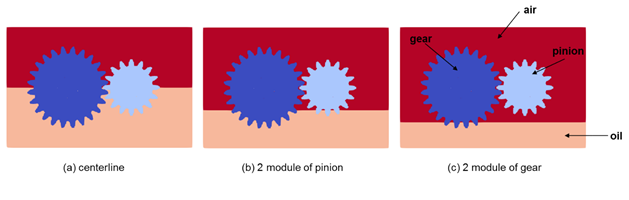
Experimental Setup
| centerline | 2 x module of the gear | 2 x module of the pinion | |
|---|---|---|---|
| 0.55 [m/s] | Run 1 | Run 2 | Run 3 |
| 1.1 [m/s] | Run 4 | Run 5 | Run 6 |
| 1.62 [m/s] | Run 7 | Run 8 | Run 9 |
Based on the diameter of the pinion and the reference tangential velocities, the corresponding Reynolds numbers are 688 (Vt = 0.55 m/s), 1375 (Vt = 1.1 m/s) and 2025 (Vt = 1.62 m/s).
Numerical Setup
The numerical setup of the cases reflects the experiments geometrically and parametrically. All simulations were multi-phase. The viscosity of oil was set to be 0.057728 Pa*s and the density was set to 902 kg/m3 (The Castrol Syntrans 75W-85), with respective oil levels and tangential velocities applied. The air phase had the viscosity of 1.84e-5 Pa*s and density was set to 1.2041 kg/ m3.
The resolution used was dx = 1mm, resulting in total of 3.2 million particles. Resolution study was performed prior to the main simulations and nanoFluidX results were independent of the spatial resolution for 0.5, 1 and 2mm particle spacings. As such, the 1 mm particle spacing was used for the rest of the simulations. The reference velocity was set to be 2.5 times the Vt value for each case. Transport velocity is used and the correction pressure is set to value of the SPH calculation (pc_factor = 1.0). Surface tension was also applied in all cases with an estimated oil-air surface tension coefficient of 0.03 N/m. Each case is simulated for 5 s of physical time, with 0.2 s of the physical time used for ramping up the gears to the set velocity (RPM).
Qualitative Results – General Flow Structure
In the first set of results, qualitative results comparing the general flow structure for the nine simulations against the experiments are presented. Results are grouped by the tangential velocity Vt; therefore, Figure 2, Figure 3 and Figure 4 show tangential velocity cases for Vt = 0.55, Vt = 1.1 and Vt = 1.62 m/s for all three oil levels, respectively.
It is important to point out that the post-processing of the nanoFluidX results involved time-averaging over the entire duration of the simulation, including the ramp-up time needed for the gears to go from 0 to Vt (0.2 s of physical time). This introduces a slight error in the simulation results; however, the error is expected to be negligible as 0.2 s comprises only four percent of the overall simulation time.
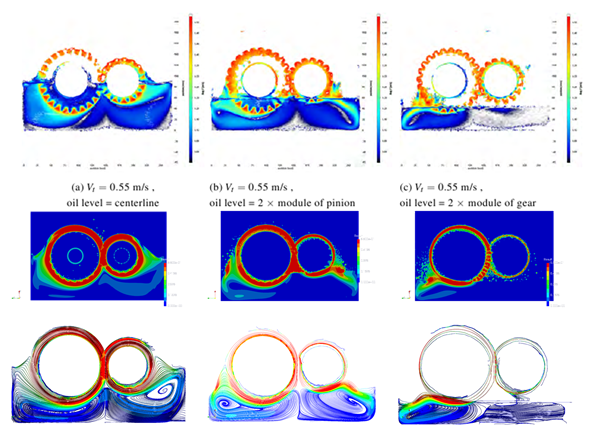
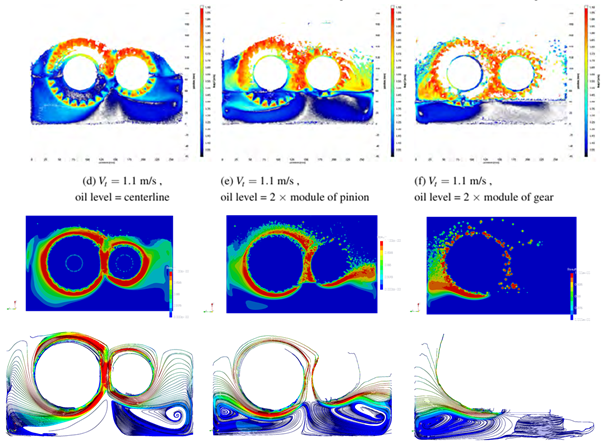
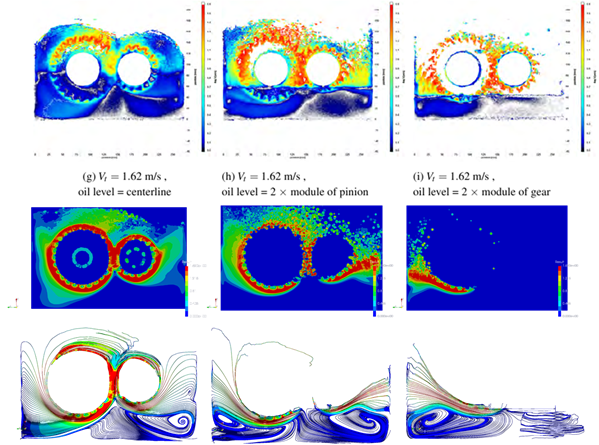
Figure 4 shows comparison of experimental and nanoFluidX results for Vt = 1.62 m/s cases, for all three oil levels. The agreement between the experiments and the simulation still remains high. The recirculation region beneath the gear in the centerline at Vt = 1.62 m/s is gone, matching the experimental results.
It can be concluded that the nanoFluidX results match the experimental results accurately to the extent that experimental uncertainties and numerical approximations allow it.
Quantitative Comparison – Velocity Profiles
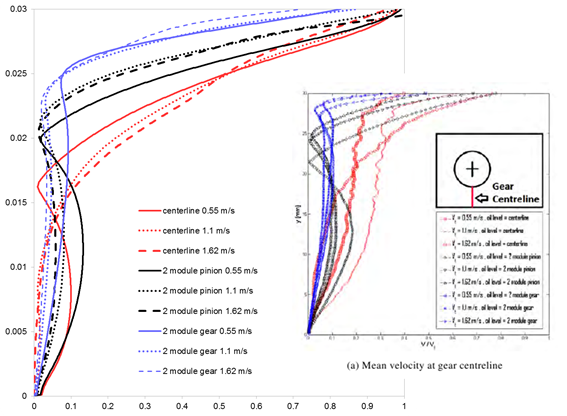
Figure 5 is showing velocity profiles directly beneath the gear. The three colors correspond to three different oil levels, while the line type corresponds to tangential velocity values. While general similarity exists, such as velocity kinks observed for the two module of pinion and two module of gear oil levels, indicating recirculation regions, you can observe that the kinks are occurring slightly higher in the experiments than in the simulations. What should also be noticed is that in the experimental results the normalized velocities are not reaching the value of one, as they ought to. Velocity of the fluid at the tip of the gear (at height of 0.03 m) should match Vt or at least closely approach that value. From the work of Hartono et al it is unclear how is this discrepancy addressed and whether it comes from unstated experimental setup parameter or experimental error.
What can also be noticed is that in the experiments the centerline oil level results do not have any kinks, implying that for this oil level there is no recirculation beneath the gear. However, in the simulation, you see that there is recirculation for the case with 0.55 m/s. The runs with 1.1 and 1.62 m/s show no recirculation, but are relatively similar in profile, unlike in the experiments. Simulation velocity results exhibit a smooth transitioning trend going from the most shallow oil level (two module of the gear) to medium oil level (two module of pinion) to the highest oil level (centerline). There is a natural evolution of the velocity profiles as the oil level and velocities change. However, such behavior can only partially be observed in the experimental results for the two lower oil levels, but the centerline oil level velocity profiles clearly differ from the velocity curves of other two oil levels.
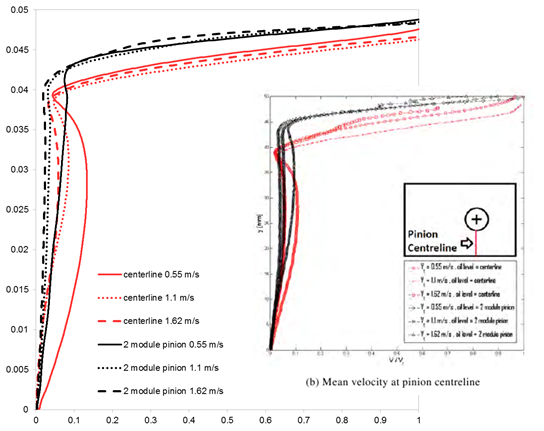
Given the excellent agreement of the experimental and simulation results in Figure 6, the following question arises: Why does the pinion side of the domain have such excellent agreement, while the gear side has limited agreement? The root of the issue is probably lying on the side of experimental uncertainties.
Qualitative Observation of Oil Aeration
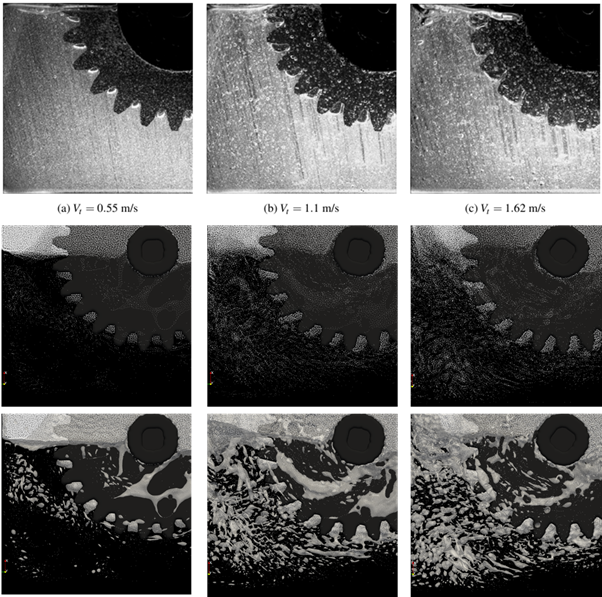
The work of Hartono et al recognizes three sizes of air bubbles in their experimental images; the small scale bubbles which are highly dispersed in the oil, occurring almost as a form of visual noise; medium size bubbles which start to occur in the fluid bulk at 1.1 m/s and are characterized by actual formation of a clear interface; and large bubbles which are occurring between the gear teeth.
All three types of bubbles increase their presence with increasing Vt, as is to be expected. While exact quantitative comparison of the results is very difficult to make, it can be clearly concluded that the simulations qualitatively follow the experimental results and show essentially all three sizes of the bubbles (small, single particle, medium, few to a dozen particles in a group and large, bubbles occurring between the gear teeth). Trend of increasing aeration of oil with increasing velocity is also observed in the simulations. These results indicate that with some additional development in the code, it would be possible to predict foaming of oil.
S. Adami, X. Hu and N. Adams, "A transport-velocity formulation for smoothed particle hydrodynamics," Journal of Computational Physics, vol. 241, pp. 292-307, 2013
E. Hartono, M. Golubev and V. Chernoray, "PIV Study of Fluid Flow Inside A Gearbox," in 10th International Symposium on Particle Image Velocimetry - PIV13, Delft, Netherlands, 2013.
E. Hartono, A. Pavlenko and V. Chernoray, "Stereo-PIV Study of Oil Flow Inside a Model Gearbox," in 17th International Symposium on Applications of Laser Techniques to Fluid Mechanics, Lisbon, Portugal, 2014
M. P. Allen and D. J. Tildesley, Computer simulation of liquids, New York: Oxford University Press, 1989.