Predict Real-Time
Predict real-time output value by changing the input value.
Predict real-time output values by changing the input values using the What-If analysis method.
-
Click Predict to view the Model Quality values.
Figure 1. Predict Real-Time 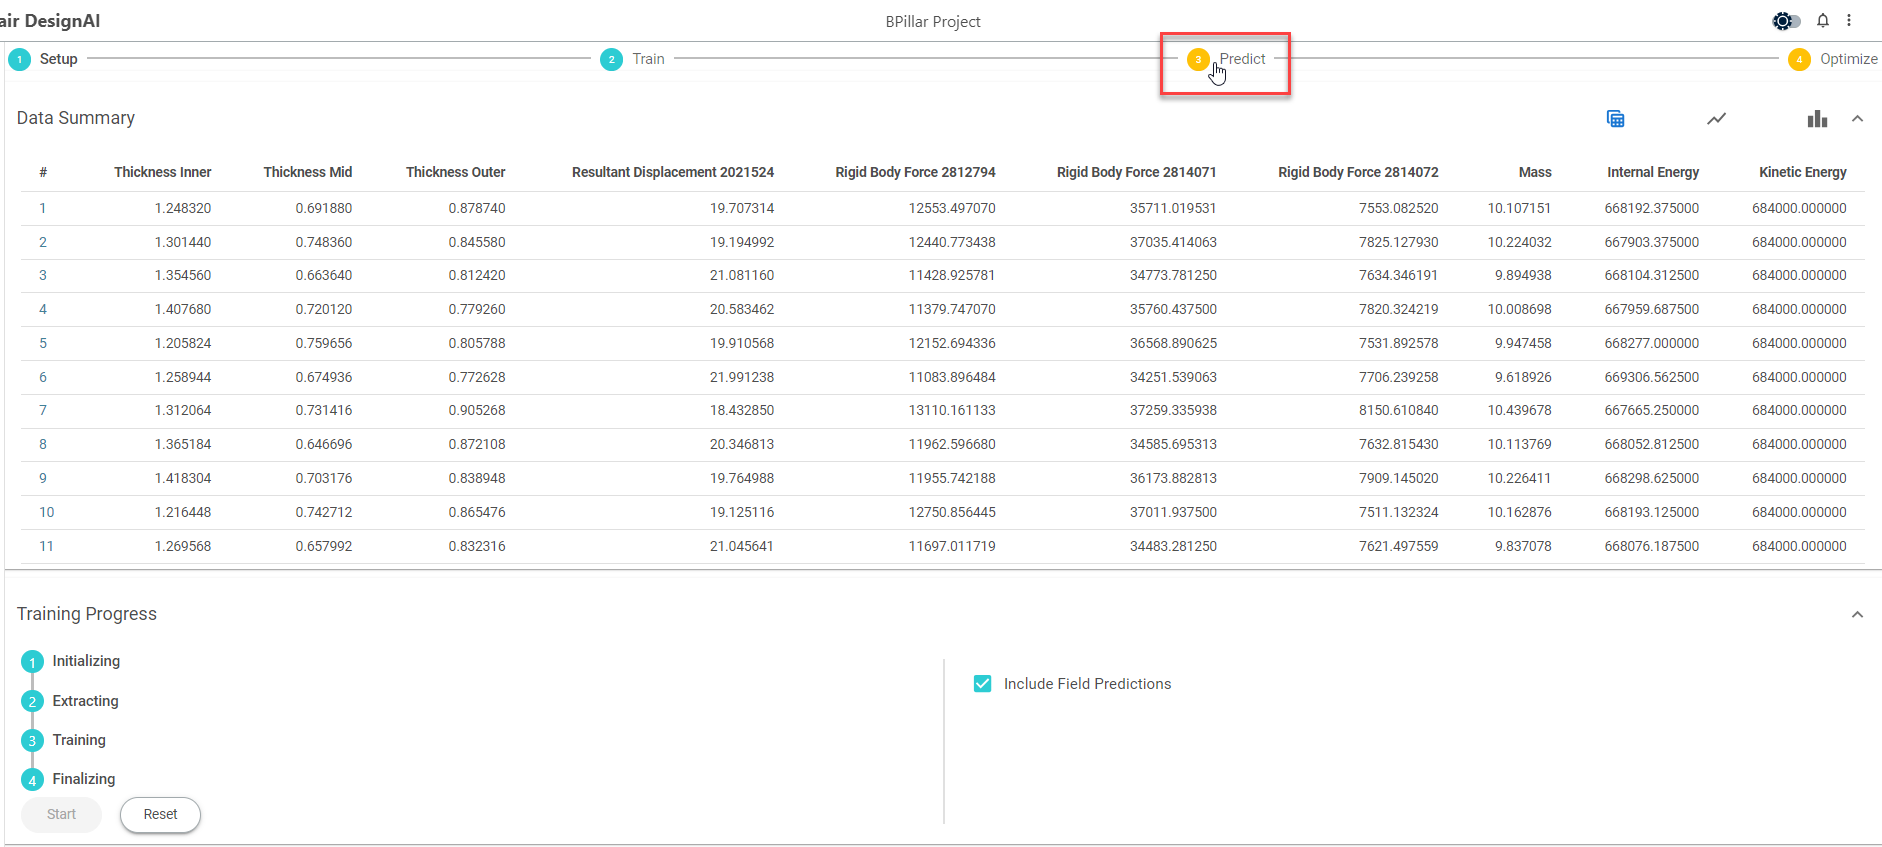
The Model Quality and Predict values are displayed.Figure 2. Predict Real-Time Information 
-
Click
 next to Model
Quality to view its values.
Figure 3. Model Quality  The model field prediction values are displayed.
Figure 4. Model Quality - Field Prediction Values 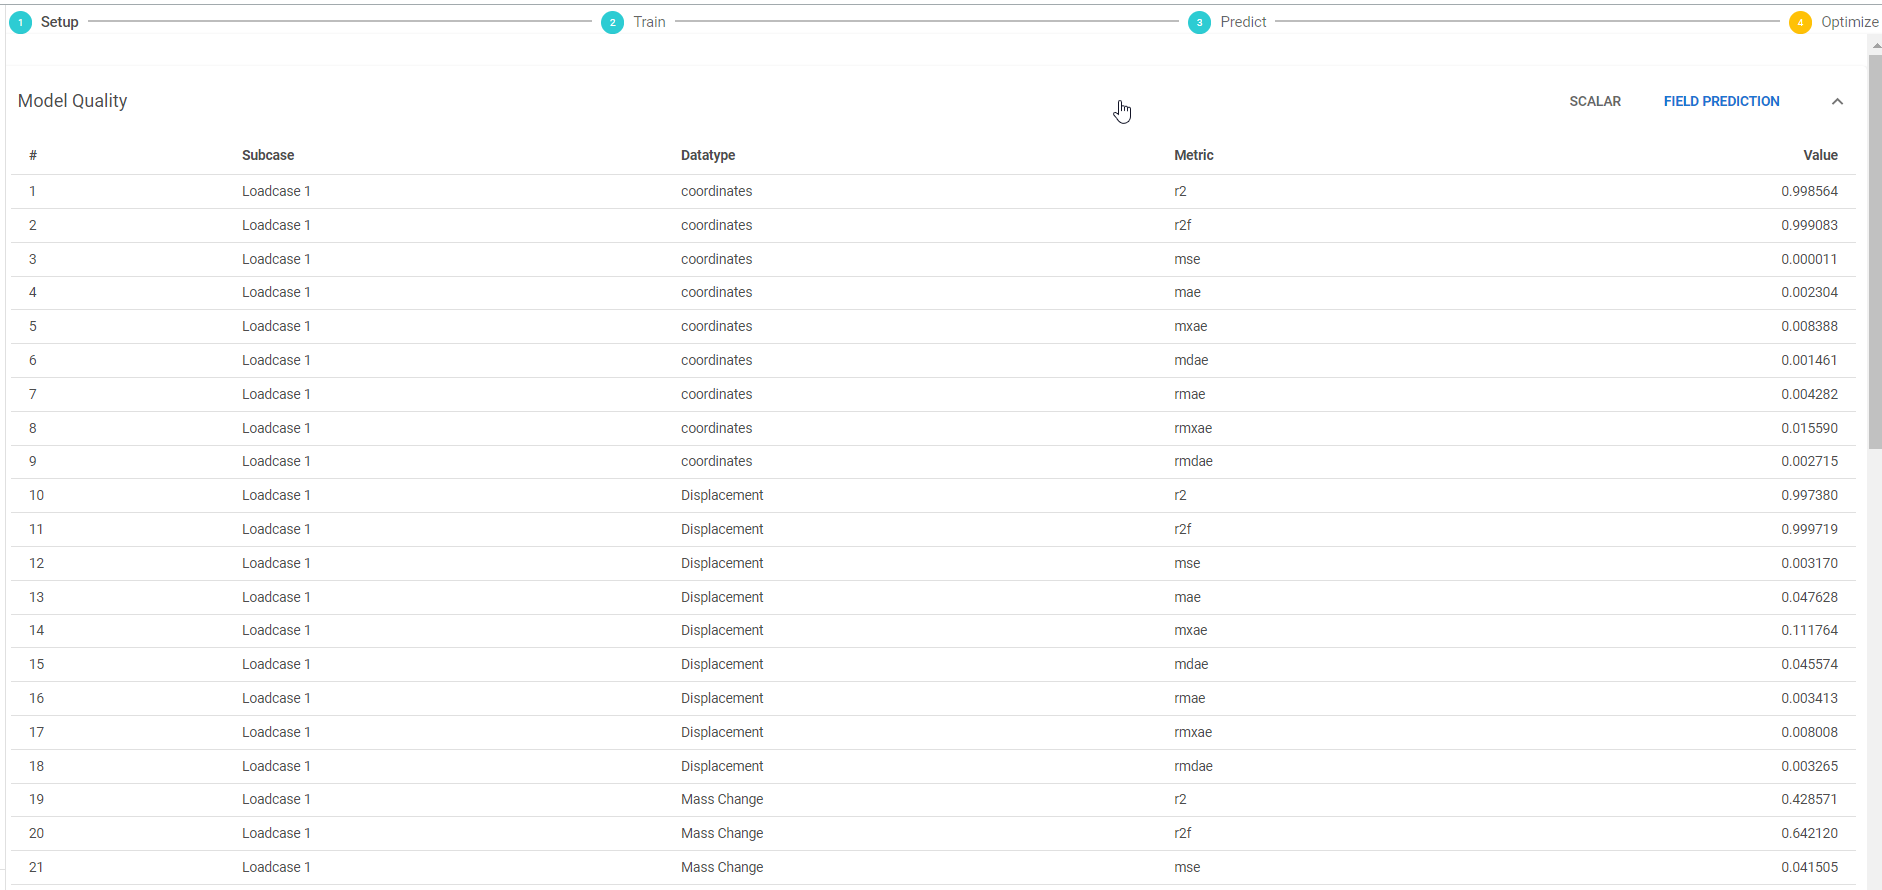 The field prediction metrics and its description are as follows:
- r2 (coefficient of determination) - Generally has a useful lower bound of zero. < 0 indicates a simple mean would provide better predictions. The desired value limit is 1 and the range is [-inf,1]
- r2f (flattened coefficient of determination) - Generally has a useful lower bound of zero. < 0 indicates a simple mean would provide better predictions. Flattening done over time axis. The desired value limit is 1 and the range is [-inf,1]
- mse (mean square error) - The desired value limit is unit^2 and the range is [0,inf]
- mae (mean absolute error), mdae (median absolute error), and mxae (maximum absolute error) - The desired value limit is 0 and the range is [0,inf]
- rmae (relative mean absolute error), rmdae (relative median absolute error), and rmxae (relative maximum absolute error) - Normalized relative to the observed range (max-min). The desired value limit is 0 and the range is [0,inf]
-
Click Scalar to view the details.
Figure 5. Model Quality - Scalar Values 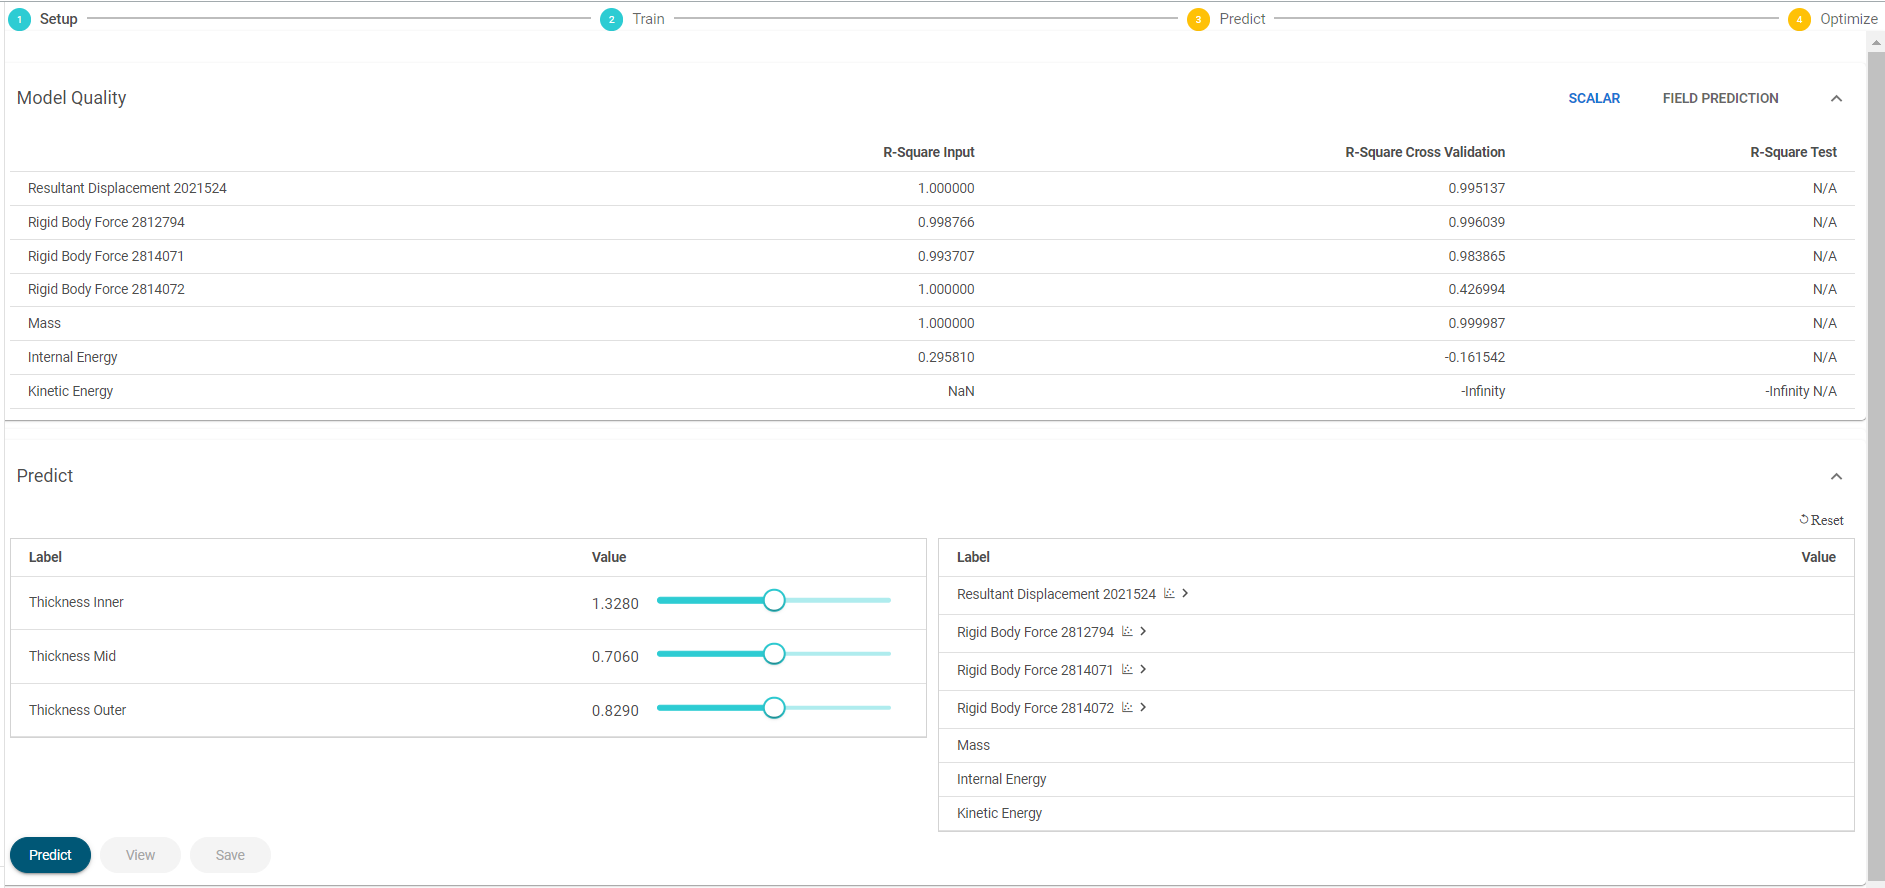
R-Square is a measure of the quality of the machine learning model. If the R-Square value is close to 1.0, the model is more accurate in predicting known data points. You can proceed with Predict Study or Optimization if R-square values are greater than 0.7. The values in the R-Square Test column are the most accurate indicators. In the absence of R-Square Test values, the values from the R-Square Cross Validation column can be used.
-
Click Predict to view the predict real-time output
values.
Figure 6. Predict Real-Time Values 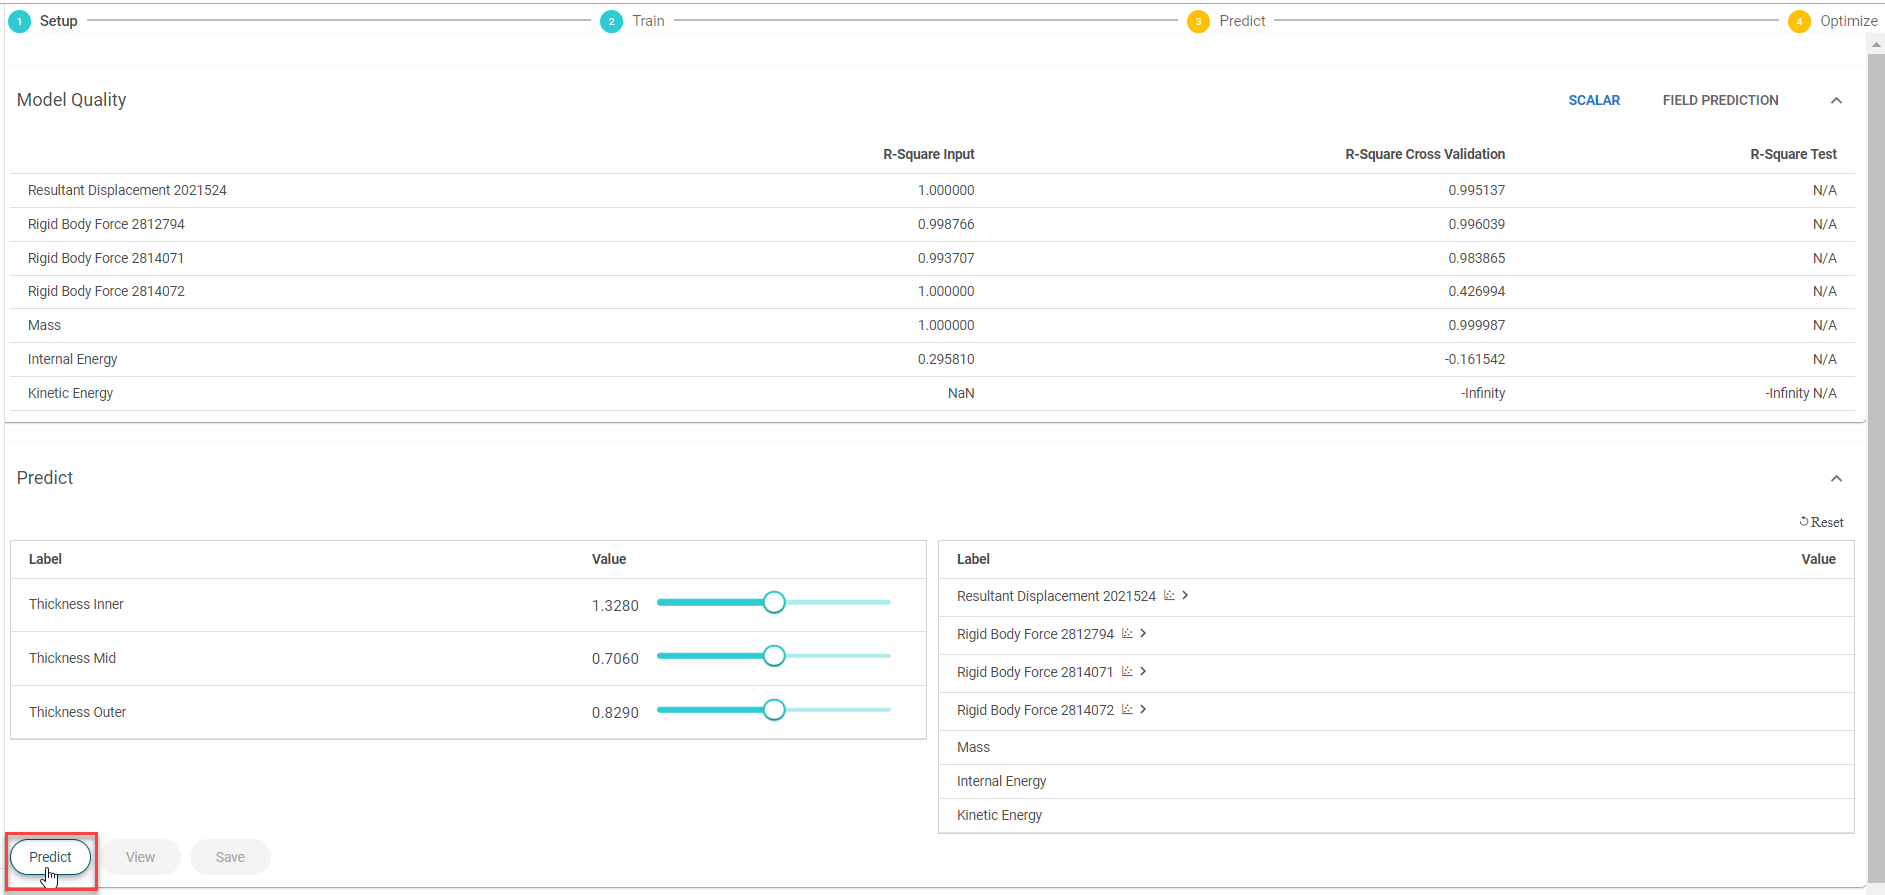 The output values are displayed.
Figure 7. Predict Real-Time Output Values 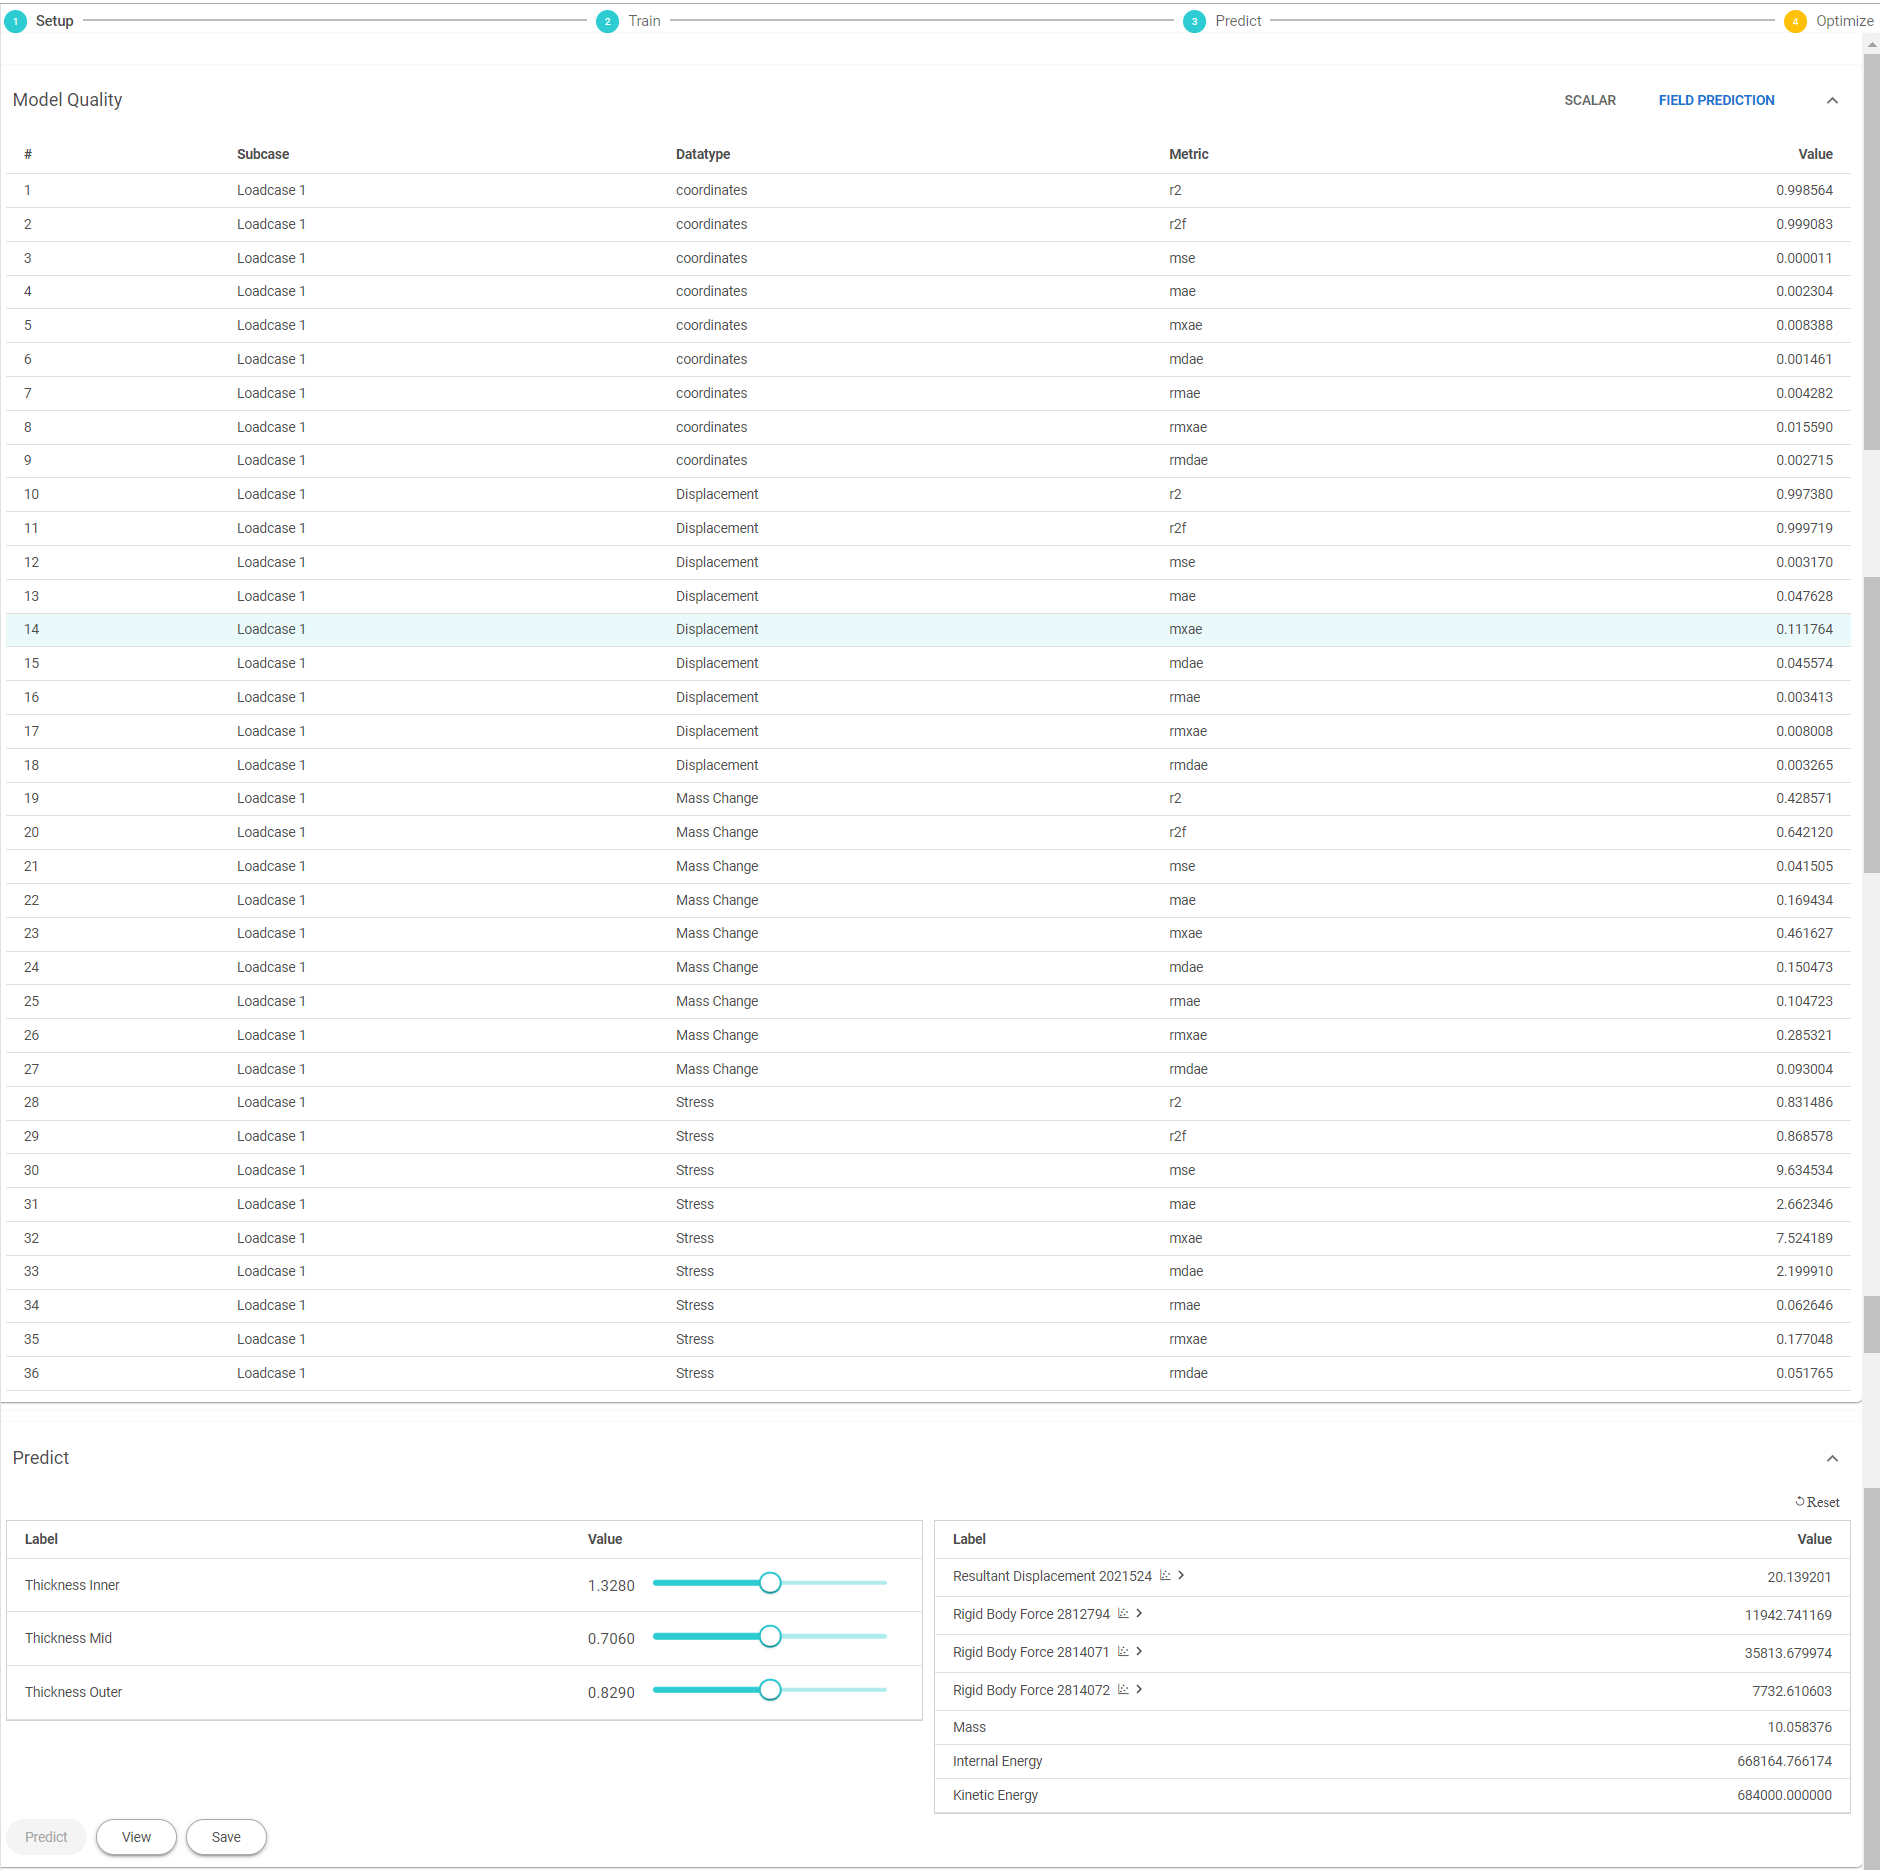
-
Click
 in the output to display the
curve.
Figure 8. Curve Prediction 
The curve for the output is displayed.Figure 9. Output Curve 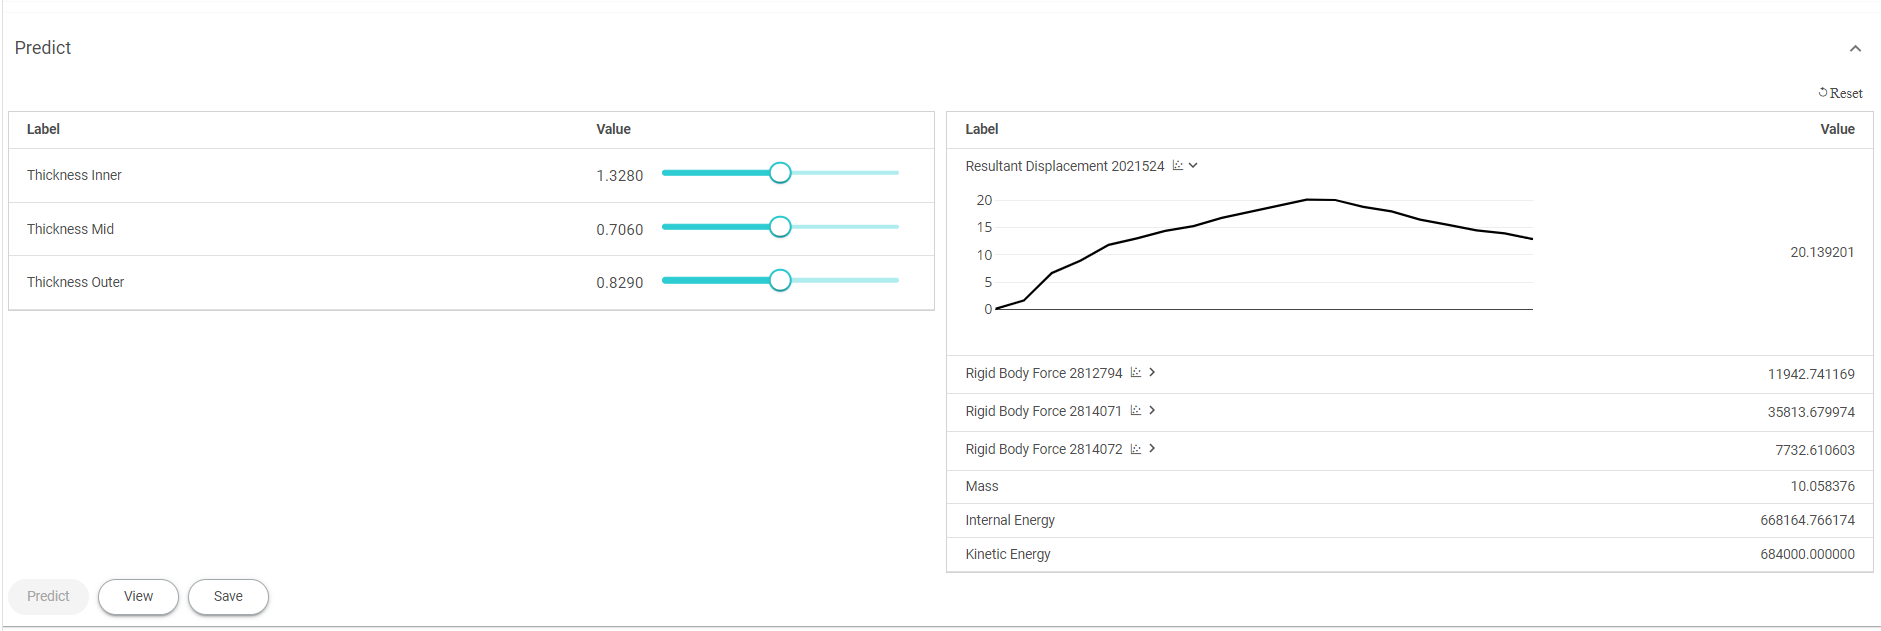
-
Click View to view the predicted model preview.
Figure 10. Predicted Model Preview - Information  The Info panel is displayed with the predicted model preview.
Figure 11. Predicted Model Preview - Info Panel 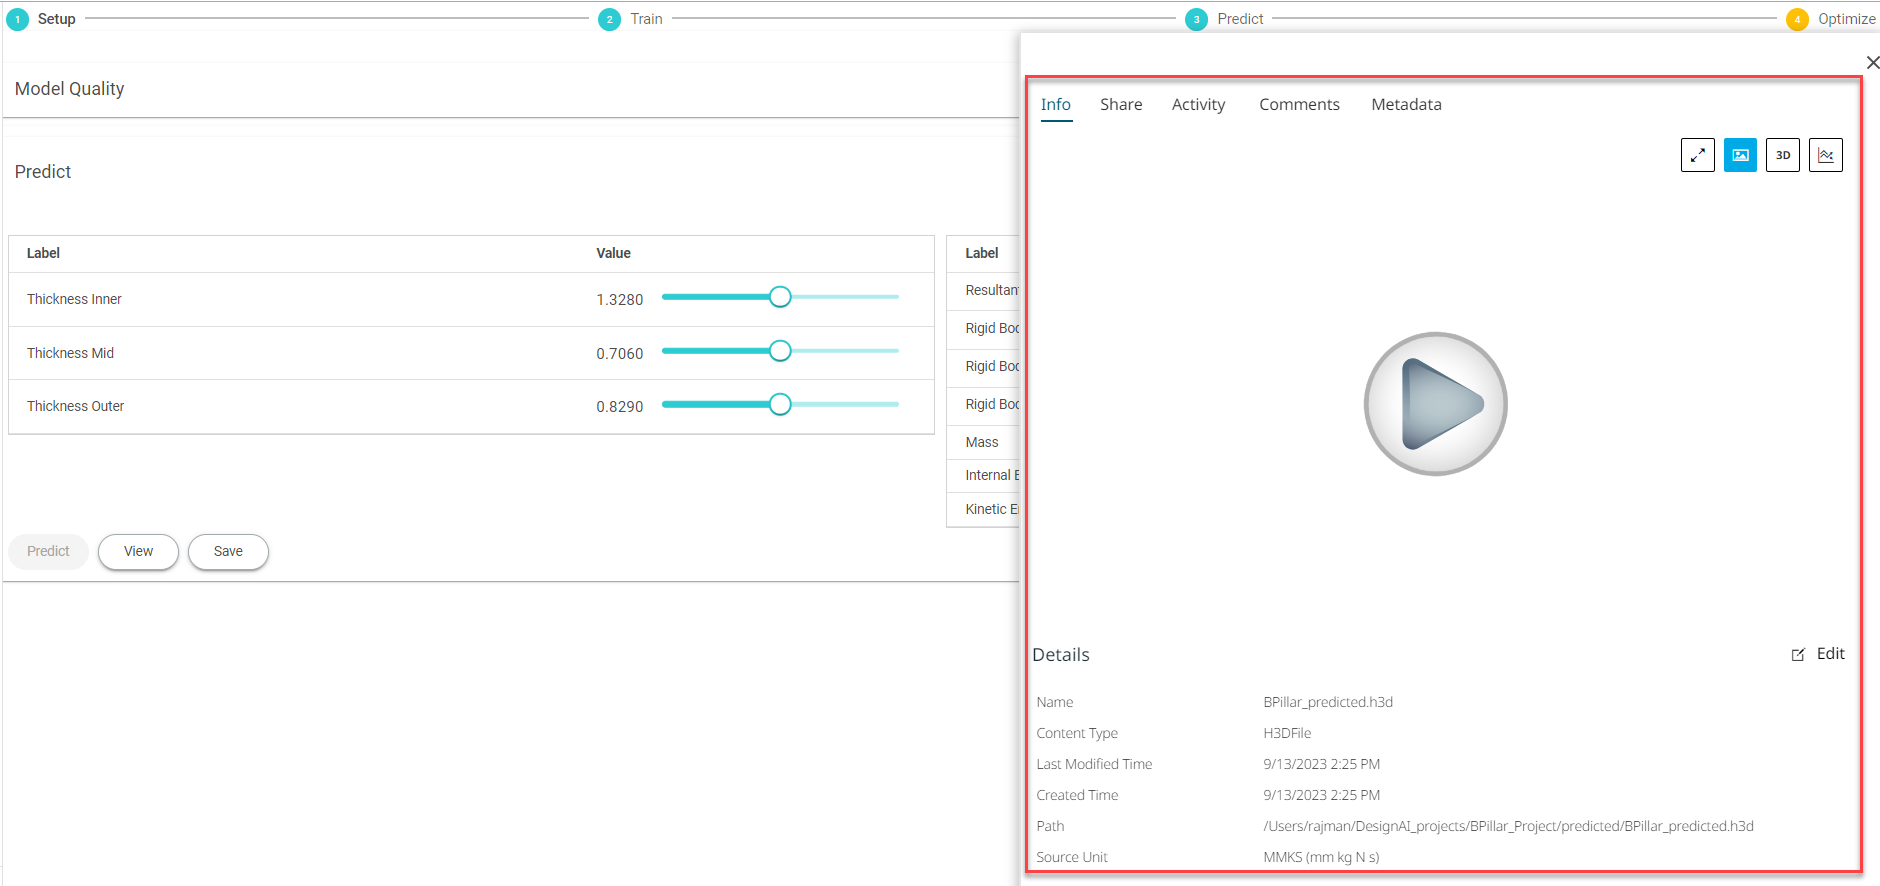
-
Click the play button in the Info panel.
The predicted model preview will be generated and displayed.
Figure 12. Predicted Model Preview - Generated Preview 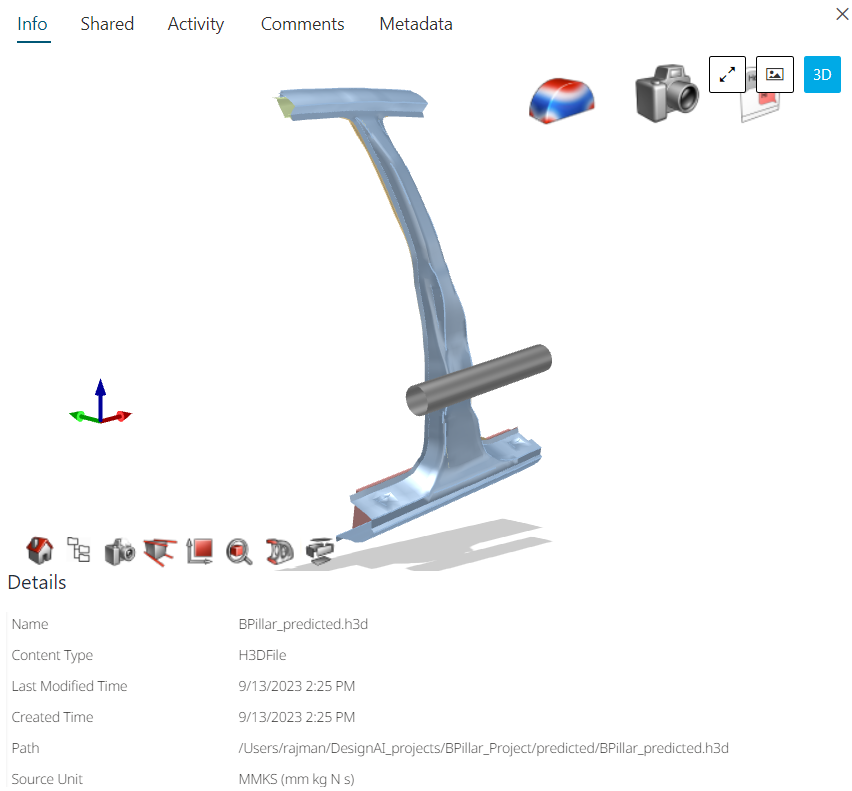
-
Click Save to save the predicted model.
Figure 13. Predicted Model Preview - Save  The save dialog box is displayed.
Figure 14. Predicted Model Preview - Save Dialog 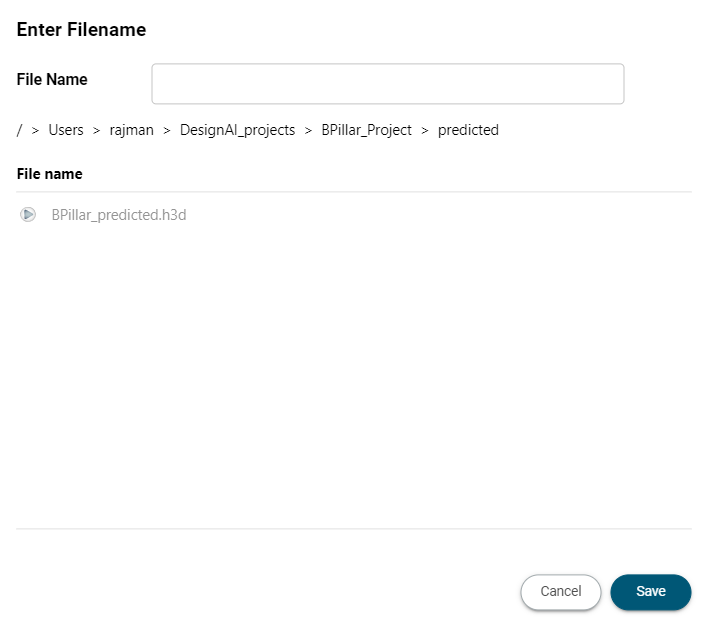
-
Enter the file name of the predicted model preview and click
Save.
The predicted model is saved in the Altair One Drive location. By default, a folder predicted is created under the project folder name. You can change the folder name by navigating the Altair One drive location.
-
Slide or double click and edit the values of trained model input value in the
Predict panel to generate a new predicted
model.
Figure 15. Predict Real-Time Values 
-
Click Predict to get the updated predict real-time
output values.
Figure 16. Predict Real-Time Updated Values  Note: Generate multiple prediction model files by changing the input values and save them to compare the predicted model files.