Post-Process Window
This window allows the user to select the type of representation to visualize the new trace.
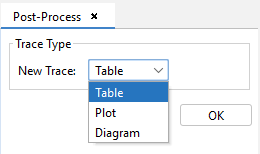
New Trace options:
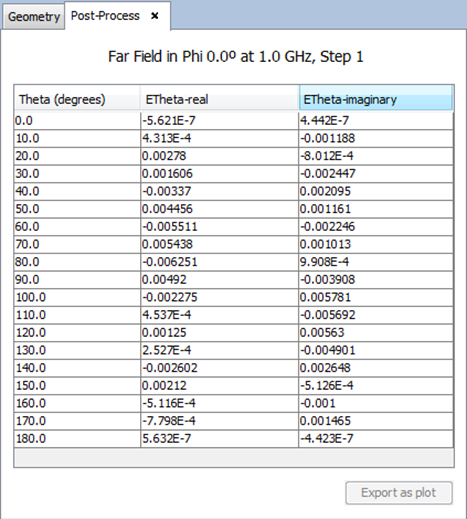
- Table visualize the results as a table of values indicating, for each value of the domain, the value of the result to be associated.
- Plot visualize the results as a plot of values drawing a line that represent the result values for each value of the domain of representation.
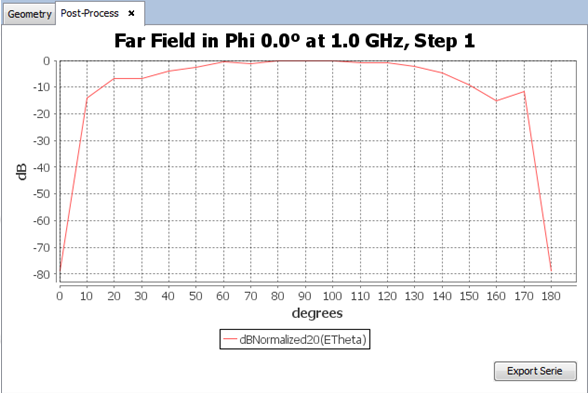
Most of plots show 2-D curves of a result field versus an input parameter. This type of graphics share additional features of zoom, raxis and curves edition, and so on. To read more information about the chart options (when clicking on the right button over a chart) see Annex 1: Graphics Advanced Options.
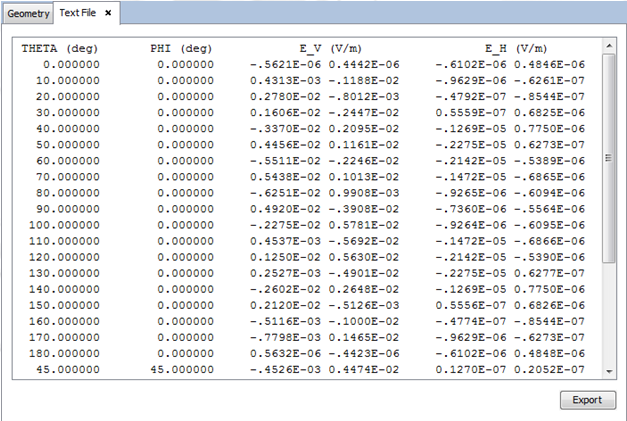
- Text File visualize the results on plain text and show the results file.