Viewing Capacity Results
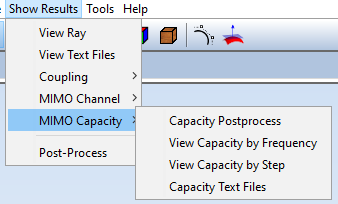
The menu "Show Results -> MIMO Capacity" provides several options to visualize the capacity of the MIMO system:
The first option, "View Capacity by Frequency", allows the visualization of the capacity in terms of the frequency at a given step. When this option is selected, the following panel will appear:
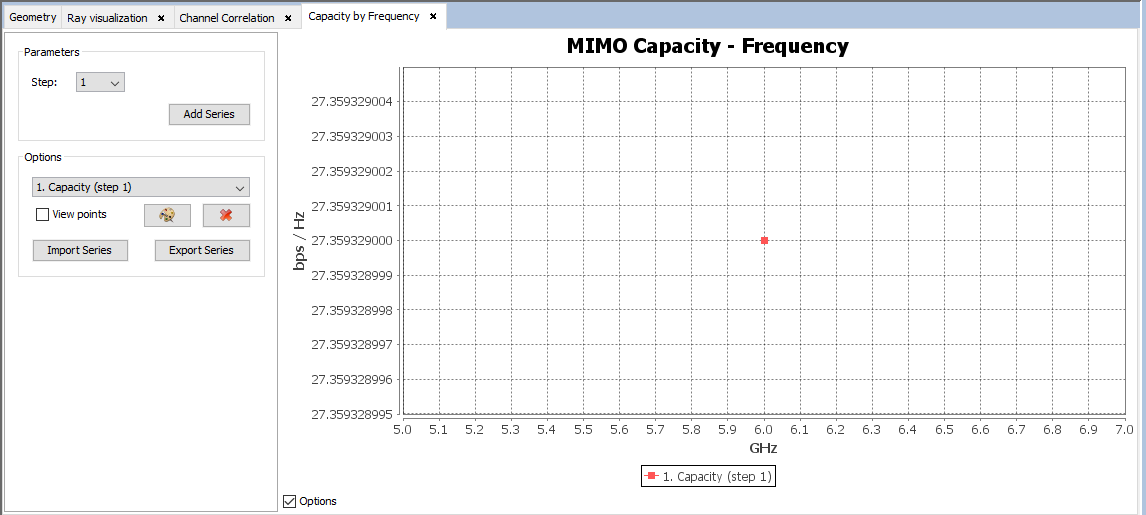
In this panel, the user can visualize many plots by selecting the step, the parameter set and pressing the "Add Series" button. In addition, it is possible to import existing series from a text file and export a currently shown series to a text file. The user can also change the color of the series and delete them.
Selecting the "View Capacity by Step" menu option will show a similar panel:

In this case, the user can visualize the capacity values in terms of the step for a given frequency value. It is possible to add more plots for different frequency values by selecting the frequency and parameter set and pressing the "Add Series" button. The rest of the functionality is the same as in the "MIMO Capacity by frequency" panel.
If the user selects the "Capacity text files" menu option, a panel will appear (right side of the next figure). This panel will ask the user the step and the parameter set they want to see the results for. When the "OK" button is pressed, the requested text file will be shown.
At the bottom of the "Text File" panel, there is a button labeled as "Save as..." that allows the user to save this text file to a user-given location in their local filesystem.