View Cuts
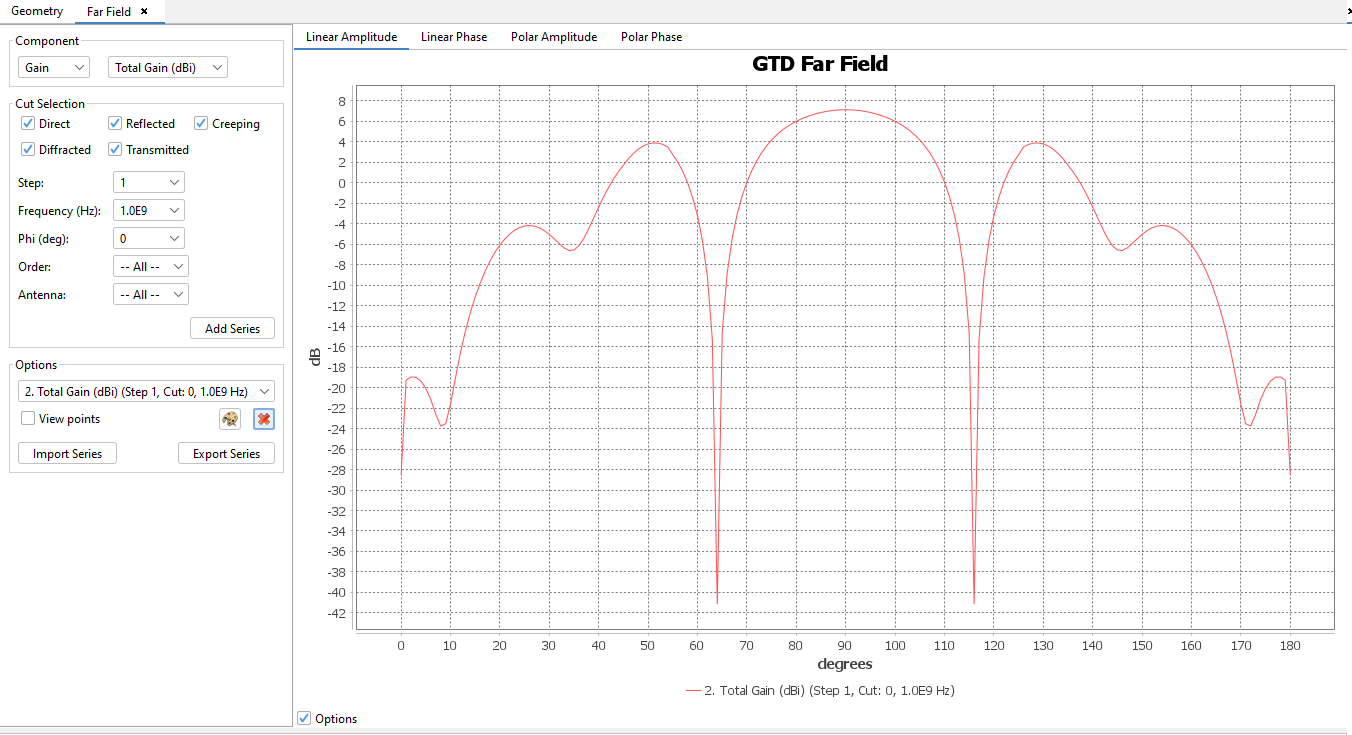
This command plots the amplitude and phase of the far field computed for each angular cut of the simulation geometry. Several cuts and frequencies can be plotted in the same graphic considering different effects and antennas. To plot a graph, the user can select the field component, the frequency, the step, the cut, the order and the antenna. A new graph will be plotted with the button Add Series. In the case that the user has set up a parametrized geometry, it is possible to select the step to visualize the results for.
It is also possible to delete a series that is selected by the user from the list with the Remove Series. The display option also allows changing the color of the series and display points. The buttons Import Series and Export Series are used for importing and exporting the selected series in List of Series to a text file.
This panel displays a plot with the results and several options for adding and removing extra series from the plot.
When initially open, the panel will display a default series in the plot that will represent the measurements for a particular component, step, and observation point, against every possible frequency and antenna that has been simulated. More series can be added, by selecting a component, step and spherical coordinates in the control panel that appears on the left side of the plot.
-
Component: the results may be plotted using different
polarization and its components:
- Lineal: Etheta, Ephi, Etotal components.
- Gain (dBi): Theta Gain, Phi Gain, Total Gain components
Figure 1. Component group 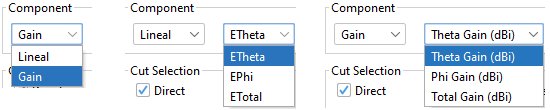
- Step: the parametric step to select. These should have been defined prior to the calculation when designing the simulation.
- Frequency: frequencies that have been simulated.
- Point: select a particular observation point.
- Order: select a particular order.
- Antenna: select a particular antenna.
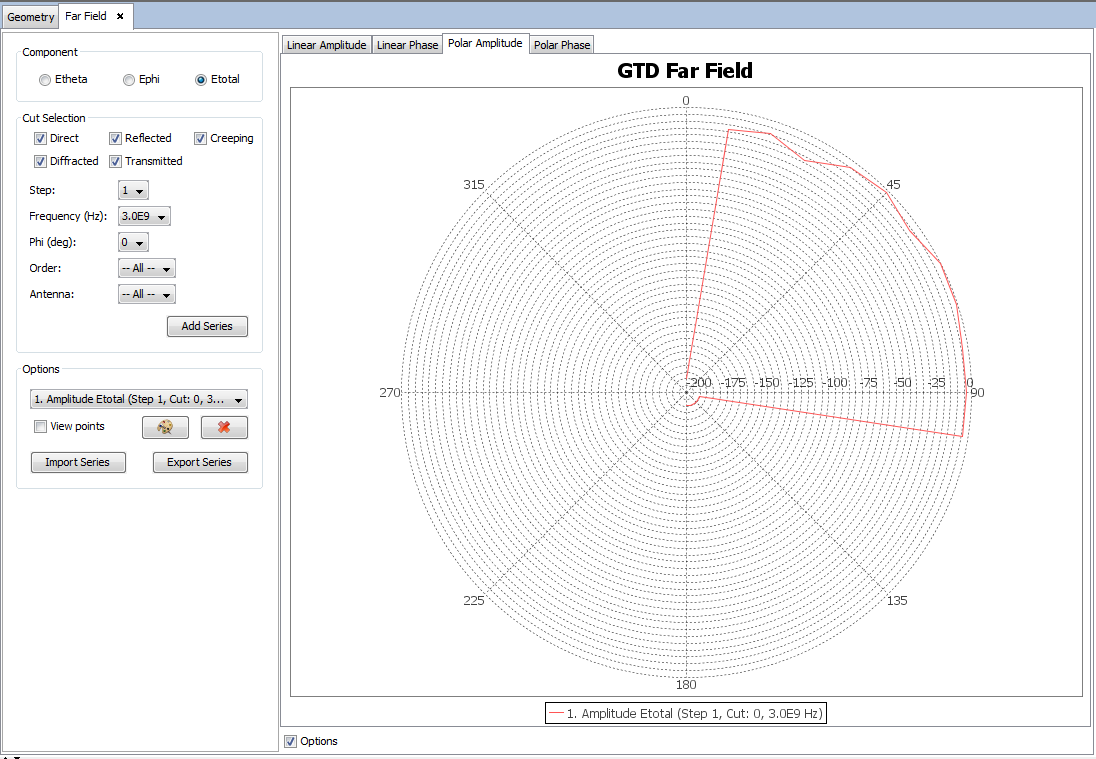
The user can also draw a polar plot with the same options used in the previous window.