Selecting Measures
Monarch Classic supports several calculations you can perform when building a summary. For each measure you include in your summary definition, you can calculate a total, average, percent of total, minimum value, maximum value, standard deviation, variance, or ratio. To perform multiple calculations on a measure, insert the measure in the summary definition once for each calculation you want to perform.
-
Go to Summary Design.
-
Select a Summary from the Summaries selector. The Summary's properties are displayed on the Summary Window.
-
Select Measures from the Summary Design ribbon.
-
Select a measure field from the fields selector to display that field's tabs and properties.
-
Go to the Formula tab.
-
Select the calculation type to perform:
-
Avg (field): Calculates the average value for all records represented by each key field value. Note that when null values are included within a field that you include as a measure, the null values are ignored. This can produce the desired result or an unexpected result, depending upon your point of view. For example, if you select Average for the Amount field to calculate average amounts, Monarch Classic calculates the average by dividing the sum of the Amount field by the Count (the number of records from which the function drew values). Records for which the Amount field value is null are not included in the calculation.
-
Count(*): Counts the number of records or non-null values represented by each key field value.
-
CountPct(*): Calculates a total for all records represented by each key field value. The totals are then divided into the summary’s grand total and are then multiplied by 100 and displayed with a trailing percent sign. Each value is therefore represented as a percentage of the grand total for all records included in the summary.
-
CountSubPct(*): Computes the group record count as a percentage of the total record count in the next larger group.
-
Cum(field): Returns the cumulative sum.
-
CumCount(*): Returns the cumulative row count.
-
CumCountPct(*): Returns the cumulative row count as a percentage of the total rows.
-
CumPct(field): Returns the cumulative sum as a percentage of the total sum.
-
Max(field): Displays the maximum value found within all records represented by each key field value.
-
Min(field): Displays the minimum value found within all records represented by each key field value.
-
Pct(field): Returns the group sum as a percentage of the total sum.
-
StdDev(): Calculates the standard deviation based upon all records represented by each key field value. Standard deviation is a measure of how widely values are dispersed from the average value (the mean). This option selects the sample method.
-
StdDevP(field): Calculates the standard deviation based upon all records represented by each key field value. Standard deviation is a measure of how widely values are dispersed from the average value (the mean). This option selects the population method.
-
SubPct(field): Returns the group sum as a percentage of the group sum of the next larger group.
-
Sum(field): Select this option to calculate a total for all records represented by each key field value.
-
Unique(field): Returns the unique value of the field if there is a unique value, otherwise returns null.
-
Var(field): Returns the variance of the field values within the group.
-
VarP(field): Returns the variance (with respect to the population) of the field values within the group.
-
-
From the General sub-tab, specify the desired display settings. You can use the default settings, or you can specify your own Custom options:
-
Title: Allows you to set the field title. (You must uncheck the Use the default title box before you can set your own title.)
-
Width: Allows you to set the column maximum width. Enter an integer into the width box.
-
Display: Allows you to hide the field. This is useful if you wish to use the field in a computation, but do not want to display it.
-
Decimals: Accepts a value representing the number of decimals to display for the Measure. Note that Monarch Classic automatically sets the decimals for each measure the same as the field displays in the Table window. For most calculation types, this setting should be appropriate. However, when calculating Percent of Total, you may want to display more or fewer decimals places.
-
Format: Selects the desired numeric formatting for the Measure from the following: general, thousands, currency, percentage, time span.
-
Alignment: Selects the desired column alignment for the Measure from the following: Left, Right, Center. If you select the Custom option, specify Format and Alignment settings.
-
-
From the Coloring and Limits sub-tab, set the colors for the column.
-
Override for entire column
-
Select this option to override the defaults and define colors for the currently selected key column.
If you click on this option, a color sample initially displays. Click the Edit button the preview box to display the Color Properties Dialog, then use the dialog to set the text color, fill color, pattern style and pattern color.

-
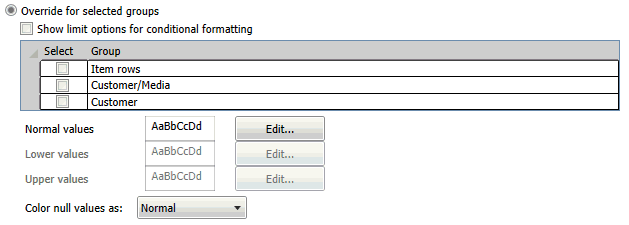
Override for selected groups
-
Select this option to override the defaults and define colors for specific groups.
If you click on this option a list of groups displays:

Select the groups you wish to color and then click the Edit button beside Normal values preview box to display the Color Properties Dialog. Use the dialog that displays to set the text color, fill color, pattern style and pattern color.
Also select values for Color null values as to set the color for null value fields.
-
Defining colors for conditional formatting
-
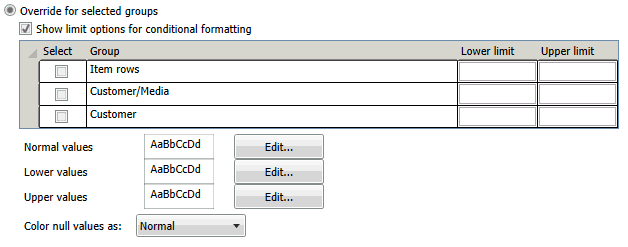
If you wish to define colors for conditional formatting, click Show limit options for conditional formatting. The screen will provide text boxes for entering the Lower and Upper limits for each group:

Select the groups you wish to color and then enter the lower limit and upper limit values. Click the Edit button beside Normal values, Lower values, and Upper values preview boxes to display the Color Properties Dialog. Use the dialog that displays to set the text color, fill color, pattern style and pattern color.
Also select values for Color null values as to set the color for null value fields.
-
Choose Accept.
Monarch Classic recalculates the summary to display the calculations you specify.
© 2025 Altair Engineering Inc. All Rights Reserved.