Overview: Summaries in Data Prep Studio
Clicking the Analyze tab in the Data Prep Studio toolbar launches a drop-down panel that allows you to create and manage summaries. A summary tabulates information for selected fields and presents the results in a one- or two-dimensional matrix, thereby allowing deeper analysis of your data. For example, suppose you had a table that listed the details of items purchased by various customers over a span of three months from a record store. You can sort this table and see who bought how many copies of what each day but you wouldn't know how much in total sales each customer produced for the quarter or what percentage their purchases made up in total sales.
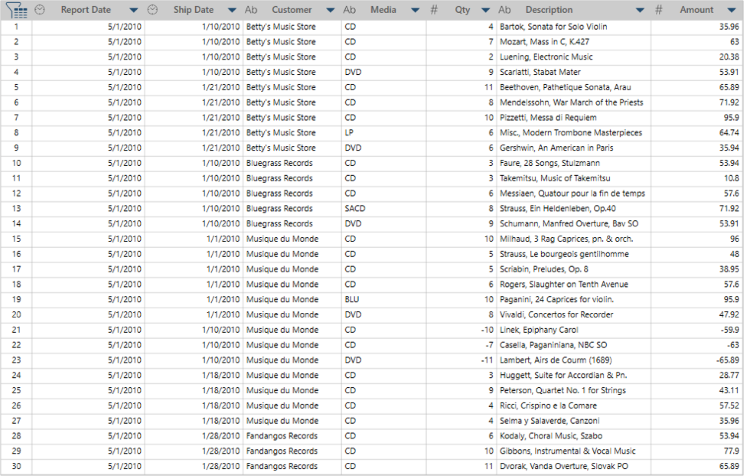
Figure 1. Excerpt of an ordinary table in DPS.
The summary below addresses these issues.
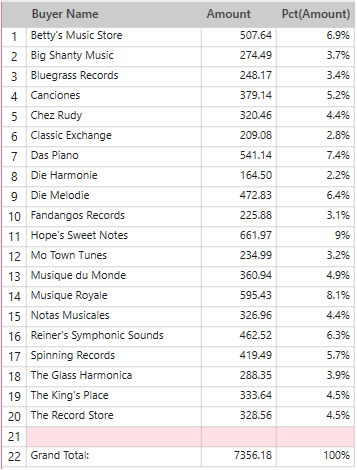
Figure 2. Summary of sales totals by customer.
Using another summary, you can even figure out which media type sells best.
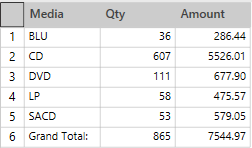
Figure 3. Summary of sales totals by media type.
These summaries tabulate information about a single key field (i.e., row). In the first summary, the key field is Customer; in the second, the key field is Media. Any field that is tabulated (or summed) is called a measure. In each of the summaries shown above, the Amount field is used as the measure.
Note: A summary must include at least one key field. A summary typically includes at least one measure, but a measure is not always required.
Key fields are used to define the summary matrix. For example, the summary in Figure 3 uses the Media field as the key field. Data Prep Studio examines the field, creates a list of all unique values (BLU, CD, LP, SACD, and DVD) and then uses these values to create the summary matrix.
Measures are numeric fields that are tabulated for each unique set of values found in the key fields. For example, in Figure 3, the Amount field is broken down into separate totals for each type of recording media.
Although only a single key field and a single measure are required to create a summary, a summary may be quite complex, including multiple key fields, columns or items, and measures. Each measure can be used to calculate the sum, average, percent of total, minimum, maximum, standard deviation, or variance values for each key. Data Prep Studio also provides a COUNT function that can be used as a measure. Rather than performing a calculation on a selected measure, the COUNT function counts the number of records for each key.
The summary in Figure 4 includes the Customer and Media fields as key fields, the COUNT function, and the Amount field as a measure.
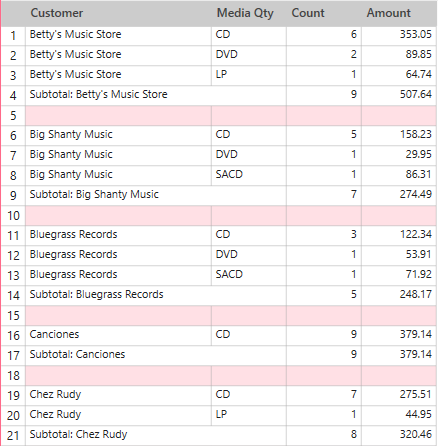
Figure 4. Sales broken down by customer and media type. The COUNT column displays the number of transactions and the Amount columns display the total dollar sales for each key.
A summary can also include item fields that expand a summary to show individual transactions. Item fields provide an advantage over viewing individual transactions in the Table window because you can use the summary to display subtotals and grand totals.
The summary in Figure 5 includes the Customer, Media, Quantity, and Description fields as key fields and the Amount field as a measure. This summary displays individual transactions for each media type within each customer. Subtotals are generated at both the Media level and the Customer level.
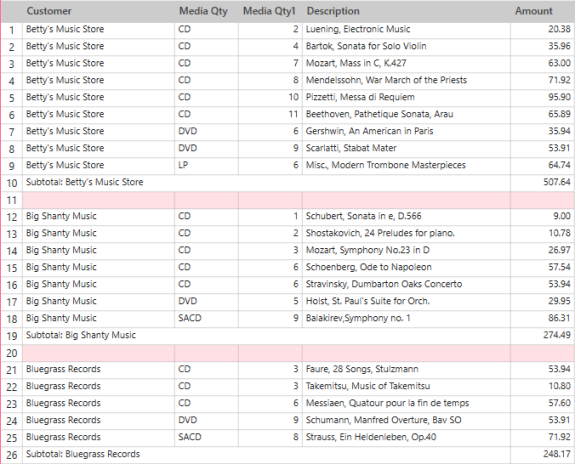
Figure 5. A summary displaying individual transactions.
Each of the summaries shown above displays key field values in columns at the left side of the summary. Another type of summary, sometimes referred to as a crosstab summary, displays summarized information about two key fields in a two-dimensional matrix. The values for one key field are displayed down the left-most column of the matrix and the values for the other key field are displayed across the top row as columns. This two-dimensional arrangement displays only a single measure at a time.
An example of this type of summary is shown in Figure 6. The Customer and Media fields are the key fields, and the Media field values are spread across the top row (columns). The Amount field is broken down into separate totals for each type of recording media. Totals for each store are displayed in the rightmost column and totals for each media type are displayed along the bottom row. The bottom right cell shows the grand total for all media types sold to all stores.
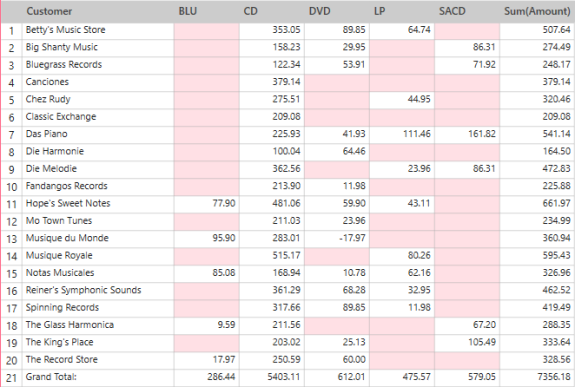
Figure 6. A two dimensional (crosstab) summary showing sales broken out by customer and media type.
Note that column formats in summaries adopt the column formats of the table from which the summary was built. Changing column formats in the Prepare window after a summary is built does not change the formats of columns in this summary.
The following topics may prove helpful as you work with summaries in Data Prep Studio:
© 2025 Altair Engineering Inc. All Rights Reserved.