The nodes dashboard provides an overview of the current state and performance of
nodes within the HPC environment.
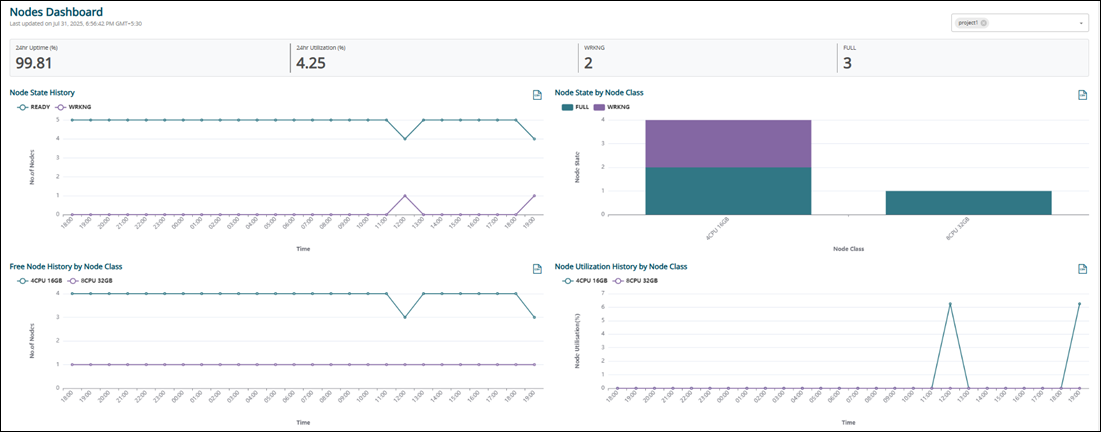
It displays real-time metrics such as the total number of nodes, active and idle
nodes, and nodes that are down. The dashboard also tracks key performance
indicators, including node utilization and uptime percentages over the last 24
hours. Additionally, it offers reports on node state trends, free node availability
by class, and overall node utilization patterns, ensuring users have a clear view of
resource distribution and efficiency across the system.Figure 1. Nodes Dashboard
The following metrics provide a real-time and historical overview of node
availability, utilization, and uptime, offering insights into system performance and
workload distribution.
Total Nodes: The current total count of nodes
recognized by the WLM.
Running Nodes: The current number of nodes actively
executing jobs.
Free Nodes: The current number of nodes that are idle
with no running jobs.
Down Nodes: The current count of nodes that are
recognized as down by the WLM.
24hr Node Utilization (%): The average node
utilization rate as a percentage over the past 24 hours.
24hr Node Uptime (%): The percentage of node-hours
indicating overall uptime in the environment, with values below 100%
signifying downtime on at least one node.
Node State History Report
The Node State History report presents the number of nodes in
each state over time.
Note: The node states are checked
periodically for this graph, so short-term fluctuations or brief job executions
may not be reflected.
Free Node History by Node Class Report
The Free Node History by Node Class report displays the number
of nodes in a free state over time, indicating nodes that are up, available, and not
currently running jobs. The data is categorized by node class, which includes the
number of cores, memory capacity, and, if applicable, the number of GPUs.
Note: The node states are checked periodically, so short-term
fluctuations or brief job executions may not be captured.
Node State by Node Class Report
The Node State by Node Class report provides the current count
of nodes in each state (Free, Running, or Down) categorized by node class, which is
determined by the number of cores, memory capacity, and, if applicable, the number
of GPUs.
Note: The node states are checked periodically, so
brief fluctuations or short-lived jobs may not be reflected in the
data.
Node Utilization History by Node Class Report
The Node Utilization History by Node Class report tracks node
utilization over time, segmented by node class, which is defined by the number of
cores, memory capacity, and, if applicable, the number of GPUs.
Note: The node states are recorded periodically, so short-term
fluctuations or brief job executions may not be fully captured in the
data.