Step 1: Use Advanced Search to find materials with specific criteria
In the example here, the materials we are searching for should match the following
criteria:
All materials should have Stress-Strain (computed) plots
Young's Modulus between 200000 MPa and 210000 MPa
Ultimate Tensile Strength < 600 MPa
Equivalent Strain < 18%
Carbon content < 8%
Click Advanced Search.
Result: The panel on
the right displays the Advanced Search options.
Figure 1. Advanced Search
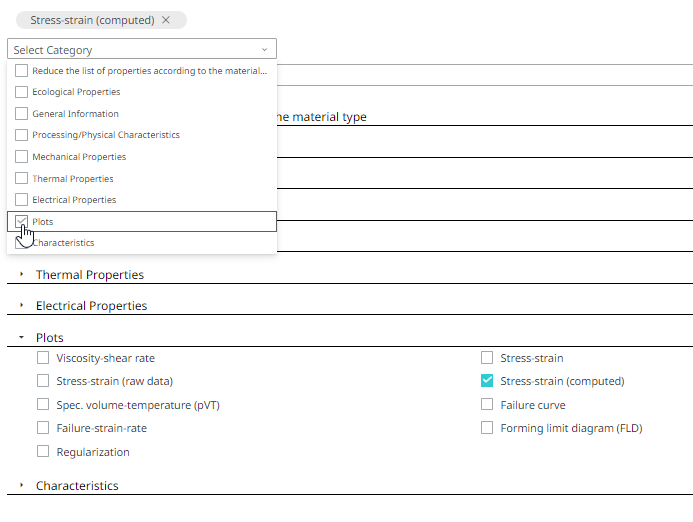
To select Stress-Strain Plots (Computed), select
Plots from the Select
Category drop down list.
Figure 2. Select Category
Select Stress-Strain (computed) from the filtered list. Figure 3. Select Property Name
Note: You can also search by the category name
or the property name in the search field to filter the data.
Deselect Plots from the Select
Category list to view material properties data of
Stress-Strain (computed) Plots category. Figure 4. Deselect Category Plots
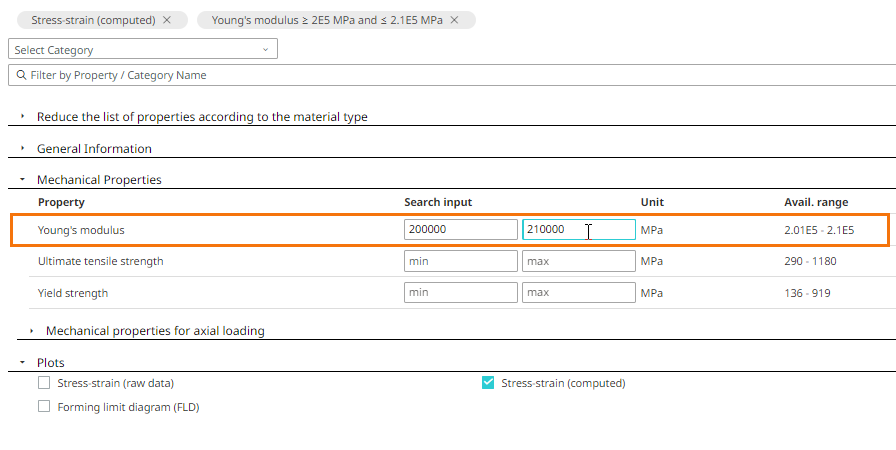
Enter the search input minimum and maximum values as 200000 MPa and 210000
MPa respectively for the mechanical property, Young's Modulus. Figure 5. Input Values for Young’s Modulus
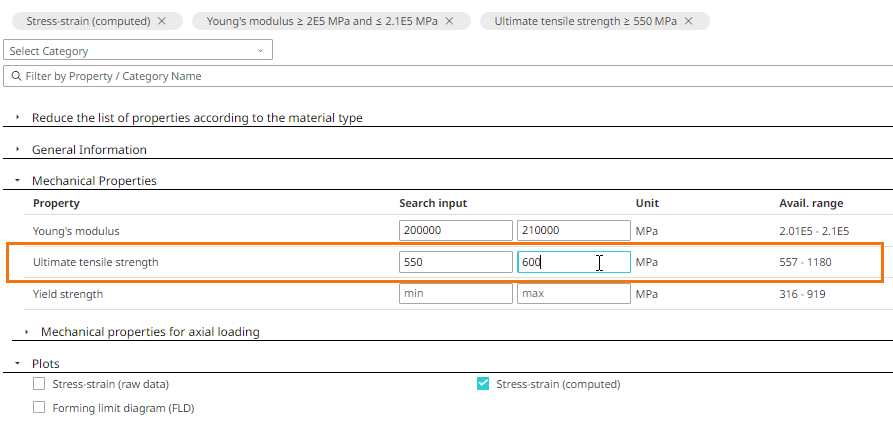
Enter the search input minimum and maximum values as 550 MPa and 600 MPa
respectively for the mechanical property, Ultimate Tensile Strength. Figure 6. Input Values for Ultimate Tensile Strength
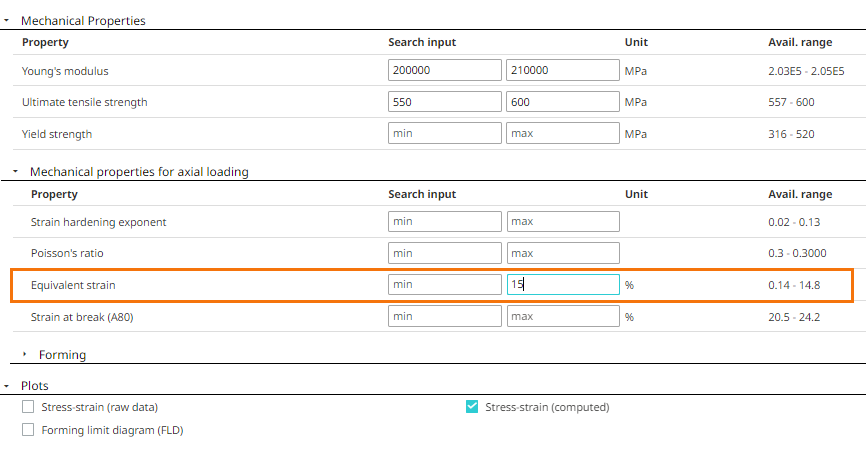
Enter the search input maximum value as 15 % for the mechanical property,
Equivalent Strain. Figure 7. Input Value for Equivalent Strength
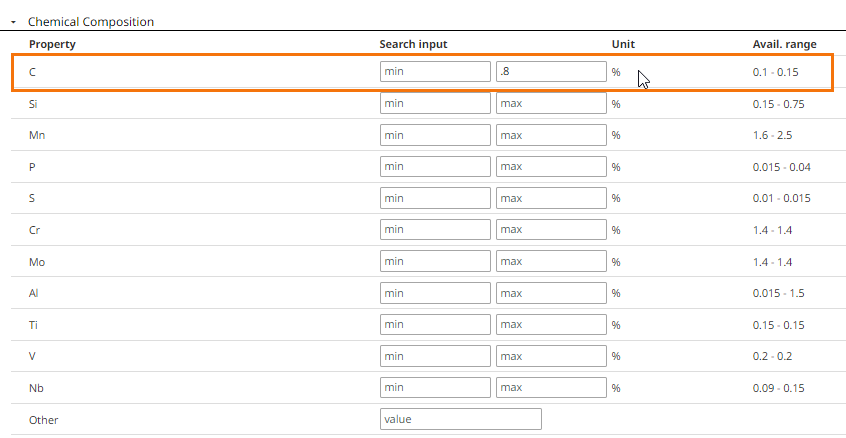
Enter the search input maximum value as 0.8 % for the chemical composition,
Carbon. Figure 8. Input Value for Carbon
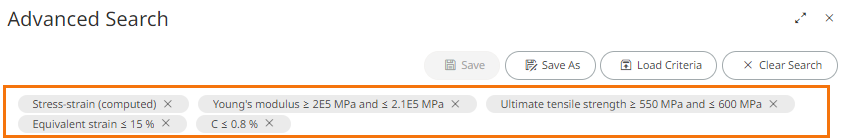
All your search queries are displayed on top. Figure 9. Search Queries
Click to close the Advanced Search
window.
Result: The advanced search result is displayed. Figure 10. View Advance Search Result
Step 2: Compare Materials
Let us compare the advanced search results to understand the material properties data
and its differences. You can compare materials data, view its differences among the
selected materials, view material data in the form of a plot, overlay plots on an
axes to compare material data, and view polar charts to visualize relationship and
differences among the selected materials.
Select the check box of the
materials from the advanced search result. Figure 11. Select Materials
Click Compare.
Result: The general information
such as material name, description and its several properties data is
displayed to compare. Figure 12. Compare Material Data
Click the Show differences only check box to view the
difference in data among the selected materials.
Figure 13. Compare Material Differences
You can also compare material data using the material plot data.
Click Plot to compare the selected materials plots.
Figure 14. Plot
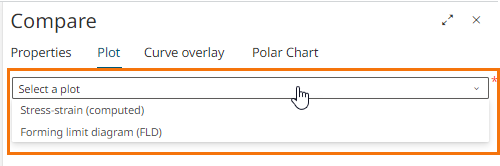
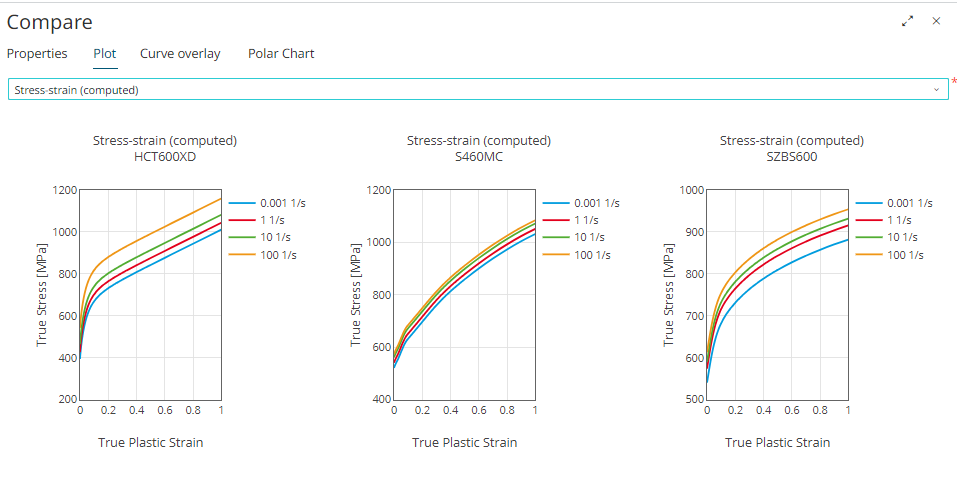
Select the required plot from the drop-down list. Figure 15. Select Plot
Result: The plot data is displayed for all the selected
materials. Figure 16. Material Data Chart
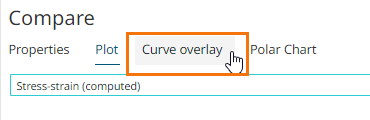
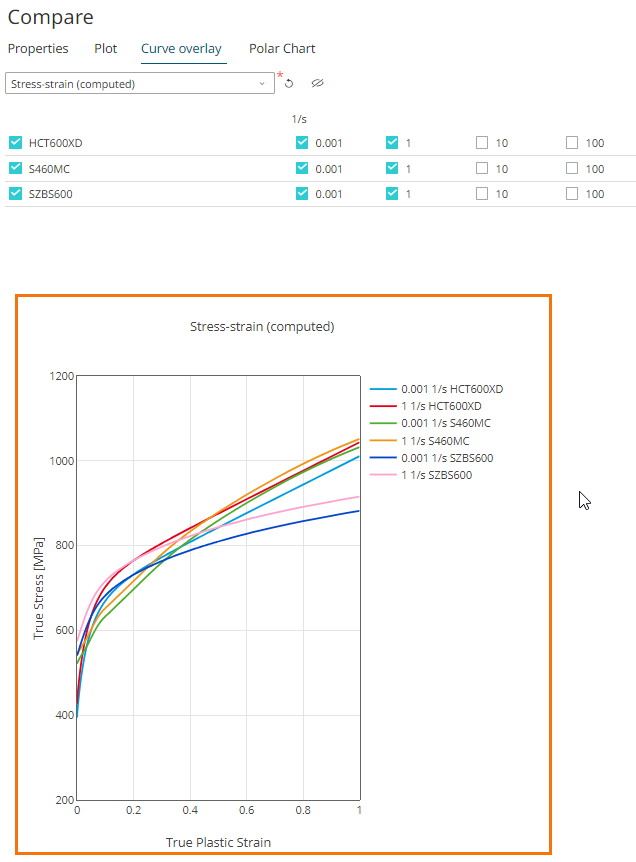
Click Curve Overlay to view the selected plots overlayed
on an axes. Figure 17. Curve Overlay
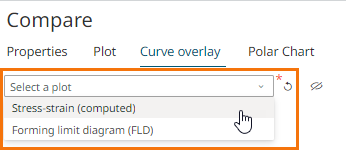
Select a plot from the drop-down list. Figure 18. Curve Values
Result: The material properties for the selected plot is
displayed.
Figure 19. Material Properties
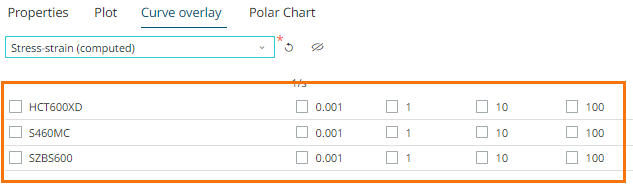
Select the required material properties.
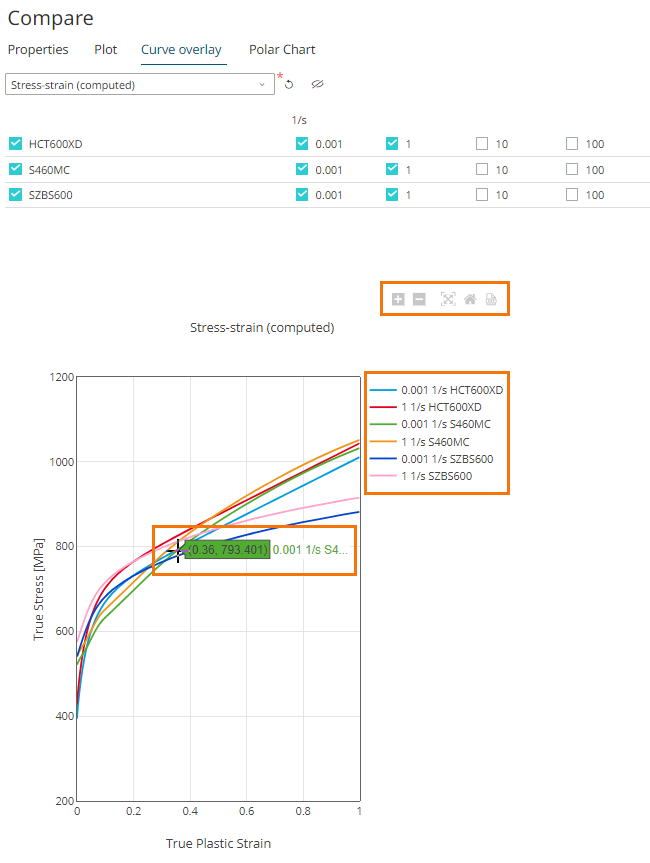
Result: The overlayed curves
are displayed.
Figure 20. Curves Overlay
Hover over the curve, to read the values. Figure 21. Chart Options
Hover over the plot area to view chart options such as zoom in, zoom
out, auto scale to original chart view, and reset axes.
You can also export the chart data as a PDF document.
Click the legend to view or hide the curve on the axes.
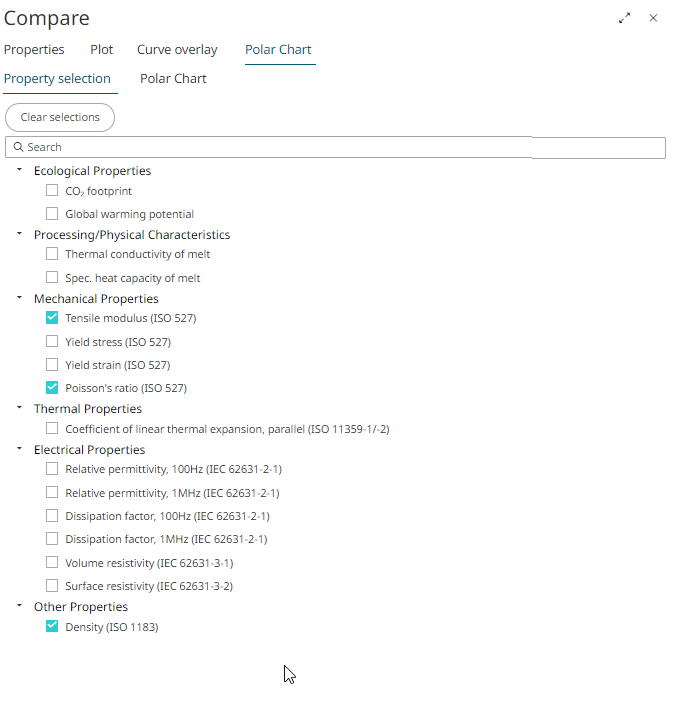
Click Polar Chart to compare multiple properties and
visualize the relationship between the materials data.
Select the properties of the materials that you wish to compare. Figure 22. Properties Selection
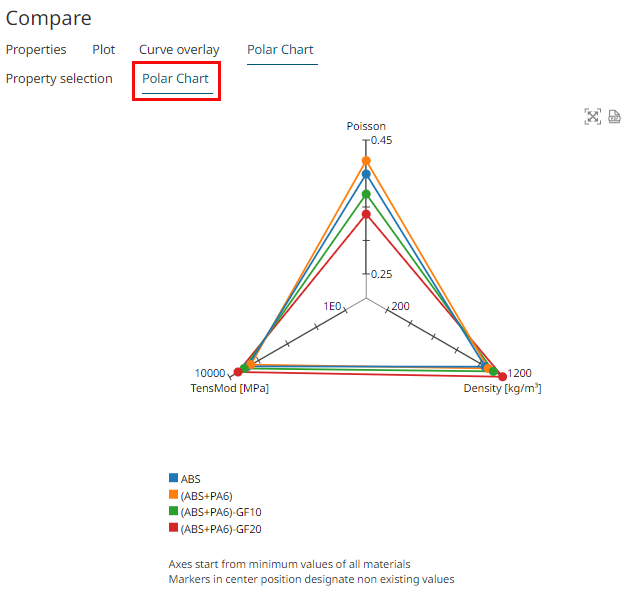
Click Polar Chart.
Result: The Polar chart is
displayed. Each material property is displayed as an axis and its material
data values are displayed for comparision.
Figure 23. Polar Chart
Click to export the polar chart data as a PDF
document.
Step 3: Download CAE Materials for Simulations
Download CAE simulation-ready files to your local workstation. You can include
generic data from the same class materials for the material properties that do not
have values provided by the producer.
Click on
a material.
Result: A panel displays the material information. Figure 24. Material Information
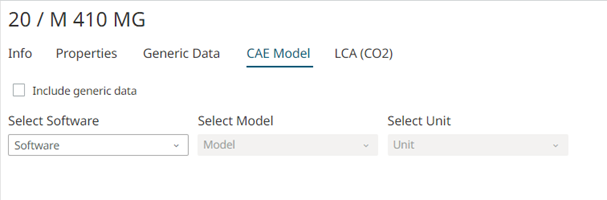
Click CAE Model.
Figure 25. CAE Model
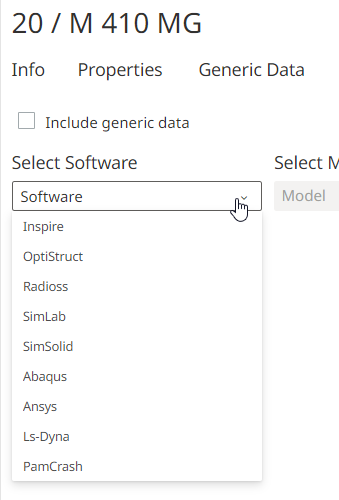
From the Select Software list, select the solver or CAE
application name. Figure 26. Software List
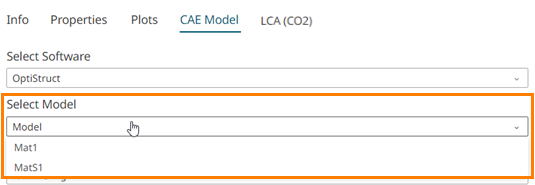
From the Select Model list, select the solver specific
model name. Figure 27. Select Model
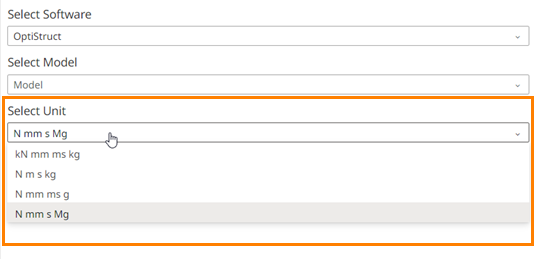
From the Select Unit list, select the required unit
system. Figure 28. Select Unit
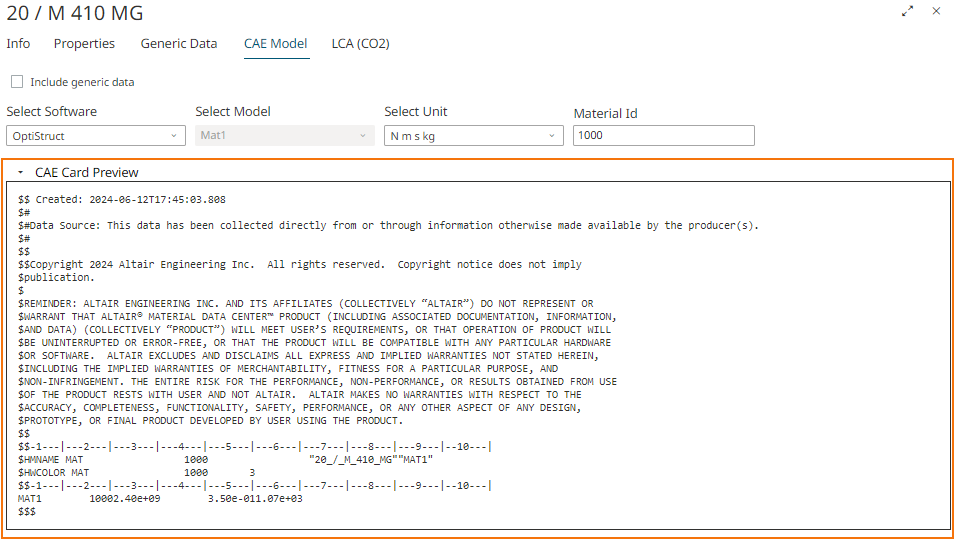
A preview of CAE material data is displayed.
By default, the preview is collapsed, click to preview the CAE Card details.
Figure 29. Preview of CAE Material Card
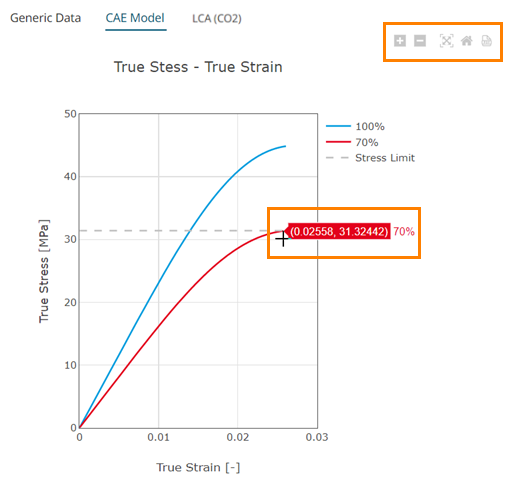
If the chart data is available the charts are displayed along with the
material properties.
Note: Use full screen to view the data and charts
together.
For example, for the ABS material, 20 / M 410 MG,
and Simsolid software the chart data is displayed. Figure 30. Simsolid CAE Model Data
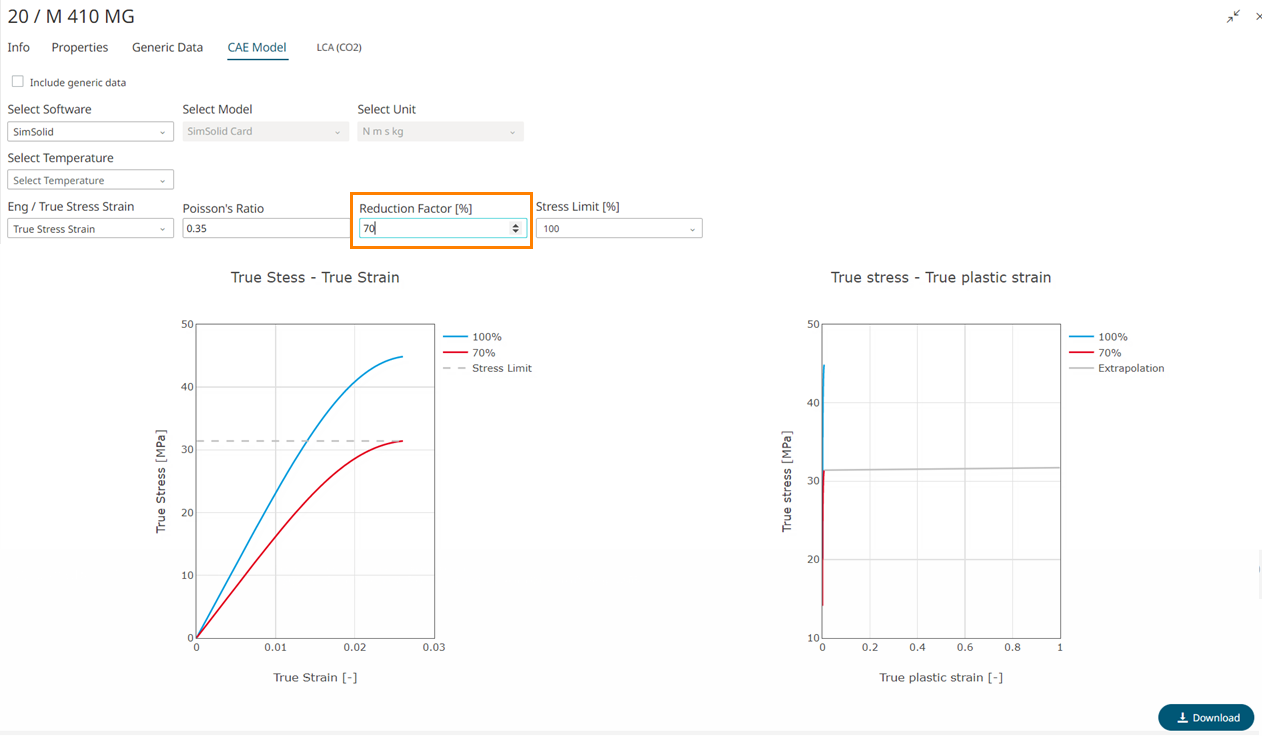
You can modify the values of the material properties to analyze the material
details. For example, modify the reduction factor to see the stress and strain
results of the selected material. Figure 31. Modify Material Properties
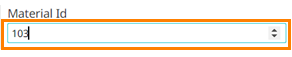
Optional: Enter an identification number for the
material in Material Id
Note: Use the arrow keys to select a number. By default,
the material id is 1000.
Figure 32. Material ID
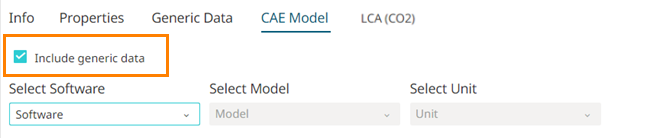
Select Include generic data to view generic data for the
missing material properties. Figure 33. Include Generic Data
Result: The CAE Model download options such as Software,
Model are extended with the generic data.
AMDC provides generic data from the
same class of materials.
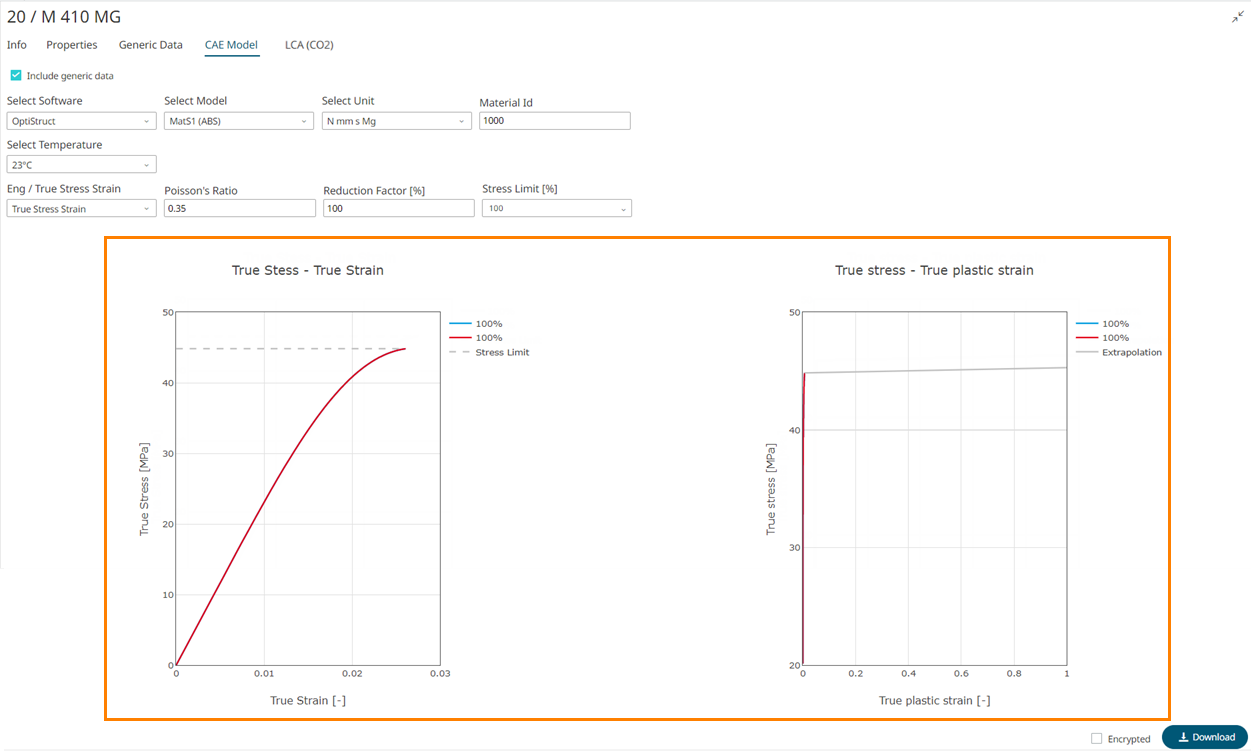
For example, for the selected ABS material
20 / M 410 MG, Optistruct software provides additional values. Figure 34. Optistruct CAE Model Data
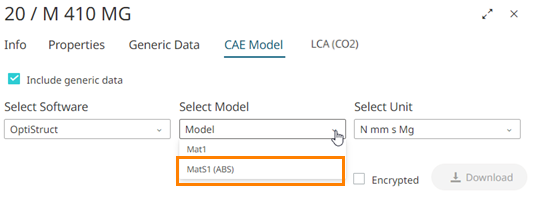
From the Select Model list, select the
additional value MatS1(ABS) to view the generic data.
Figure 35. Optistruct with Generic Data
Hover over the plot area to view chart options such as zoom in,
zoom out, auto scale to original chart view, reset axes, and export it as a
PDF document. Figure 36. Chart Options
Hover over the curve to read the curve values.
Click Download
Note: You can also
encrypt the CAE file data before downloading it for Optistruct and Radioss
Solvers.
Result: The CAE Model file is downloaded to your
personalized download location on your local workstation.
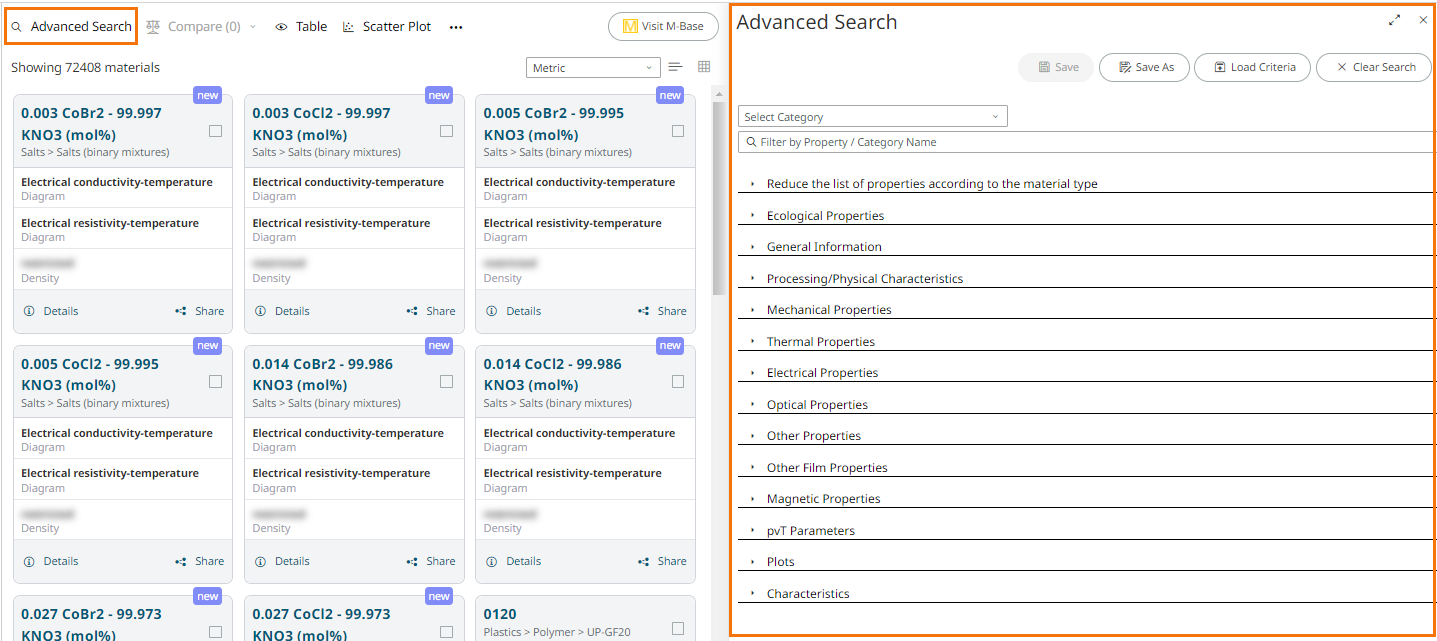
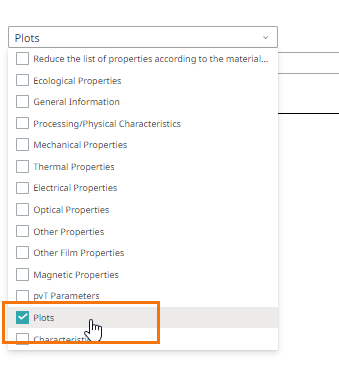 Figure 2. Select Category
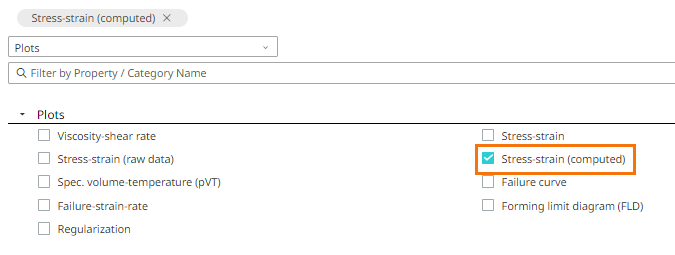
 to close the Advanced Search
window. Result: The advanced search result is displayed.
to close the Advanced Search
window. Result: The advanced search result is displayed.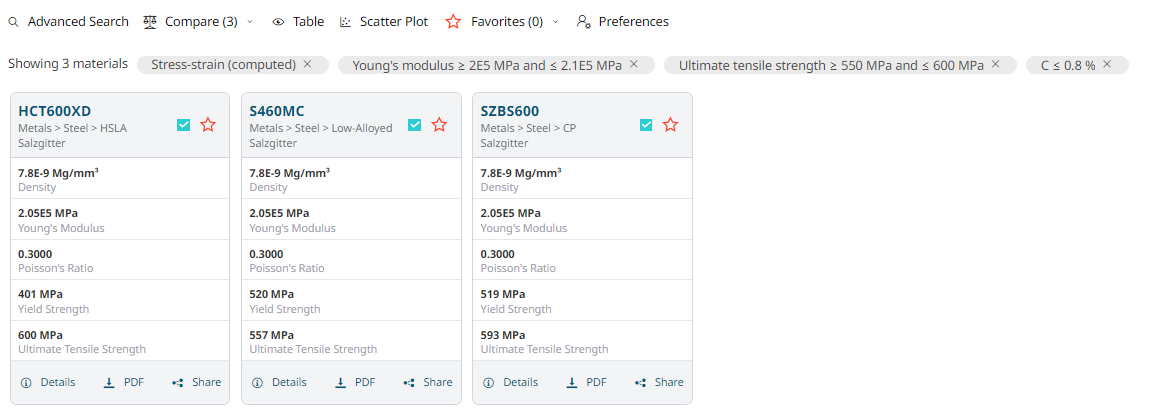
 of the
materials from the advanced search result.
of the
materials from the advanced search result.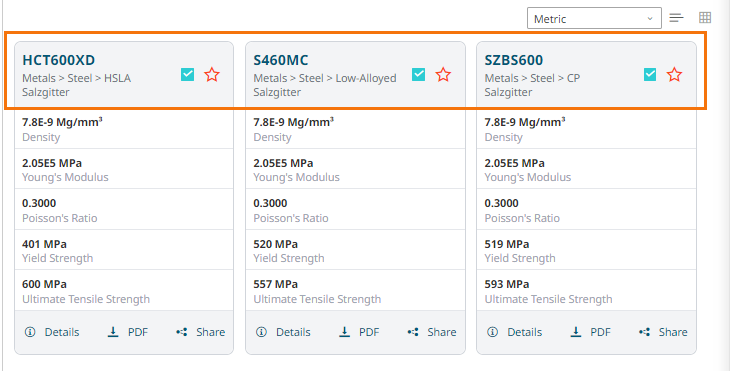
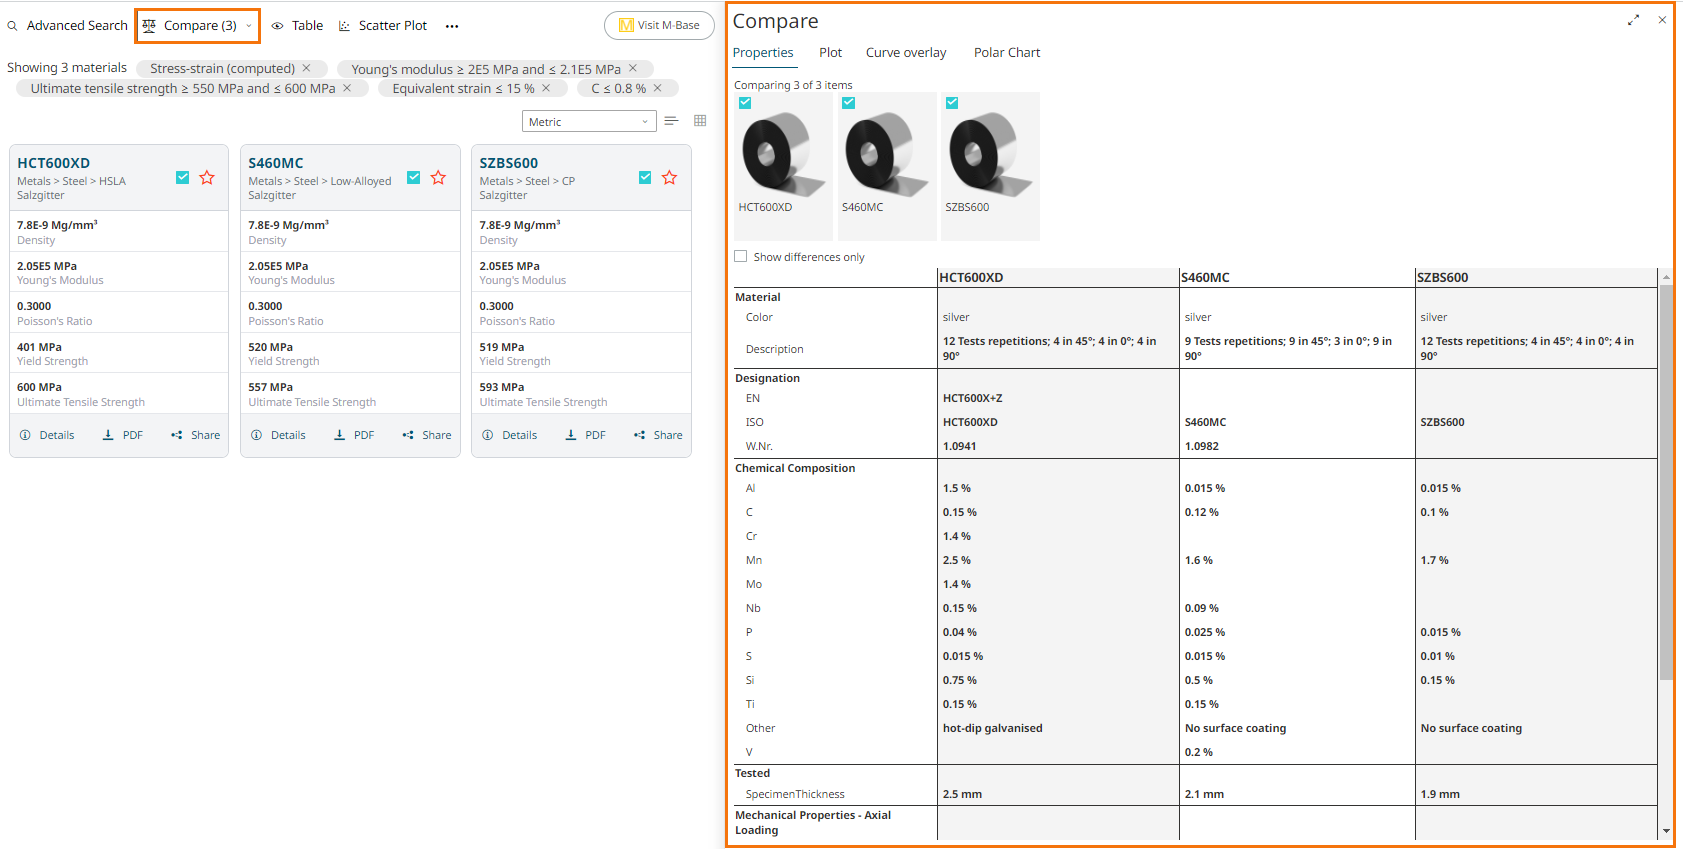
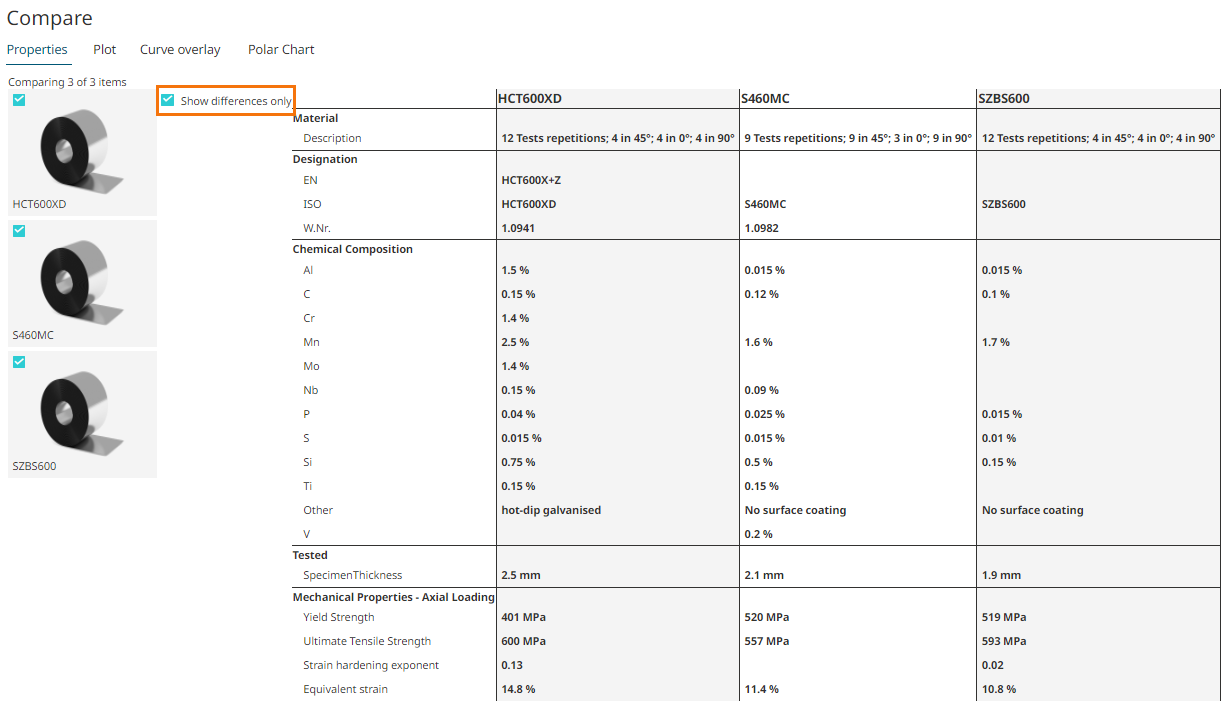 Figure 13. Compare Material Differences
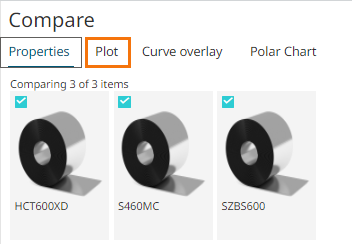
 to export the polar chart data as a PDF
document.
to export the polar chart data as a PDF
document. on
a material. Result: A panel displays the material information.
on
a material. Result: A panel displays the material information.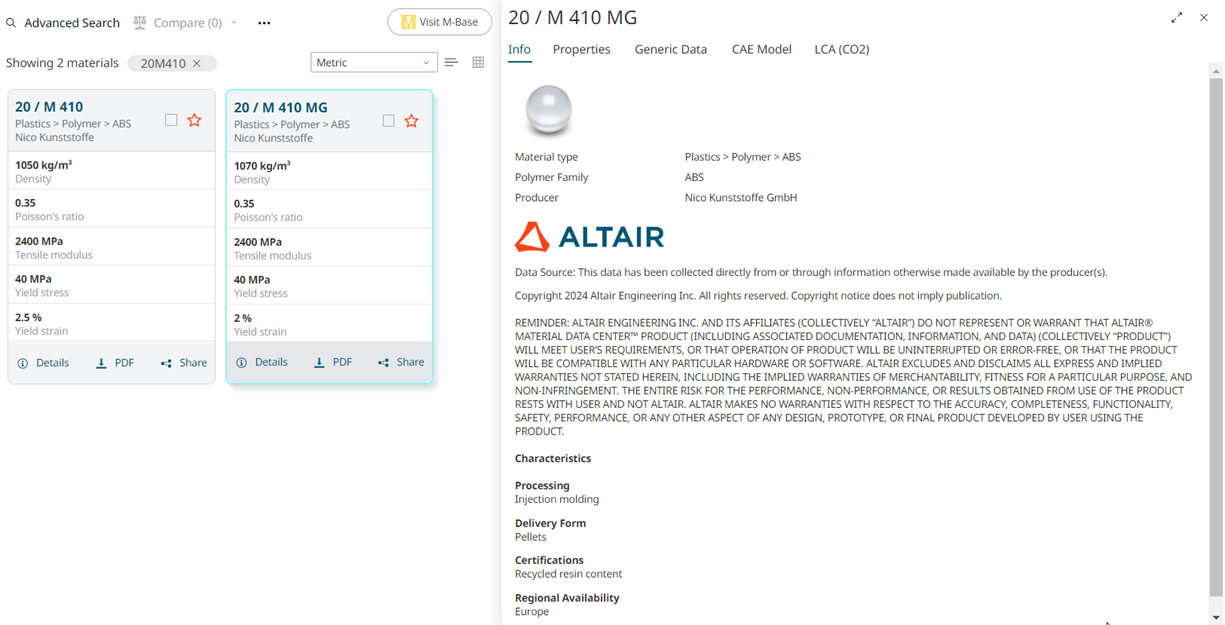
 to preview the CAE Card details.If the chart data is available the charts are displayed along with the material properties.Note: Use full screen
 to view the data and charts
together.For example, for the ABS material, 20 / M 410 MG, and Simsolid software the chart data is displayed.
to view the data and charts
together.For example, for the ABS material, 20 / M 410 MG, and Simsolid software the chart data is displayed.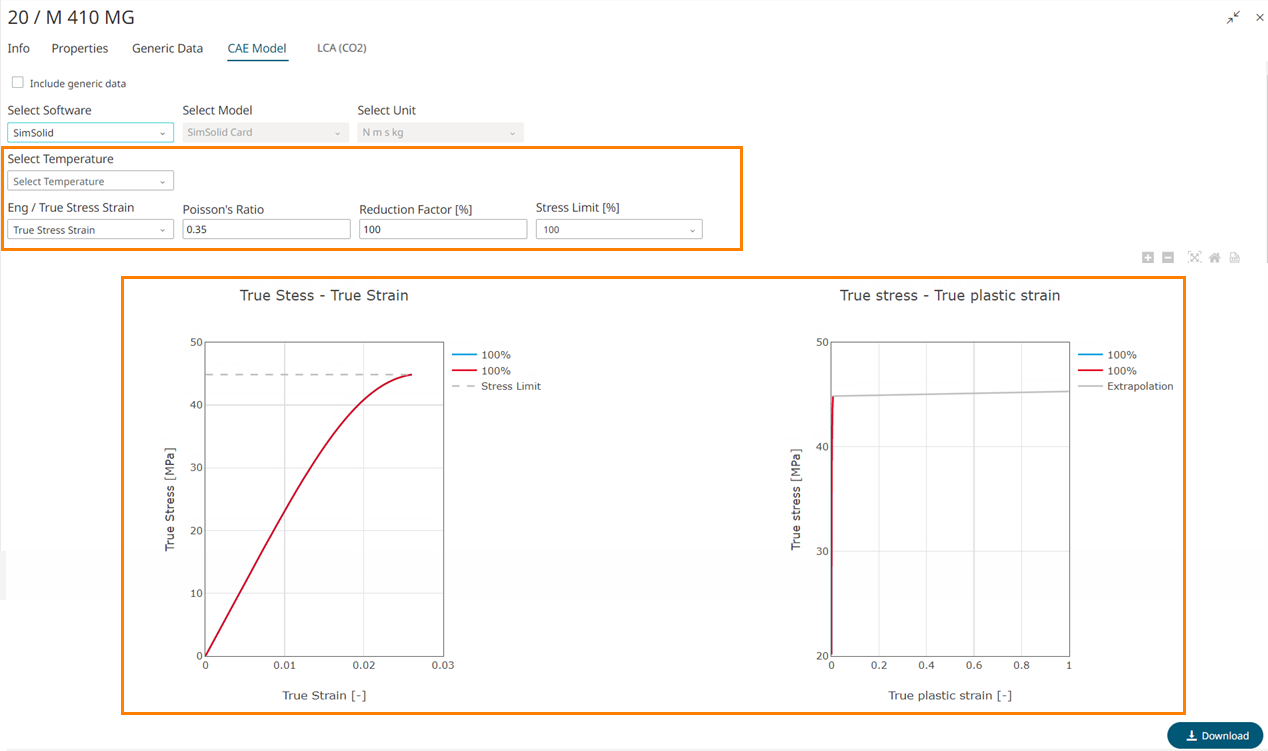

 to select a number. By default,
the material id is 1000.
to select a number. By default,
the material id is 1000.