Strain Rate Panel
If strain-dependent tests have been performed (tensile tests at different velocities) and the curves are available, you can include strain rate dependencies.
-
Select Copy&Move in the list box, a new panel will
appear.
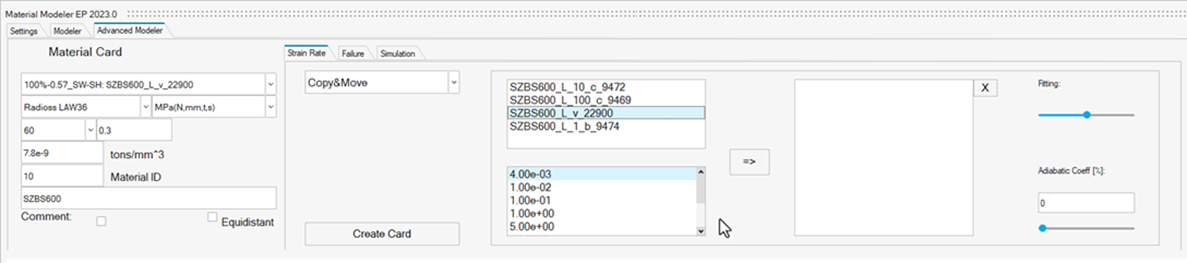
Figure 1. Combine Strain Rate and CurveThe available strain-dependent test curves are displayed in the list box in the upper left corner.
The available values for the strain rates are displayed in the field at the bottom left (you can define these values on the Settings tab).
-
Repeat this step for all the strain-dependent curves that you want to include
in the material card. All associated curves and strain rates in the left fields
are moved to the right list box. You can also delete the curves in the left list
box by using the cross and repeating the procedure.
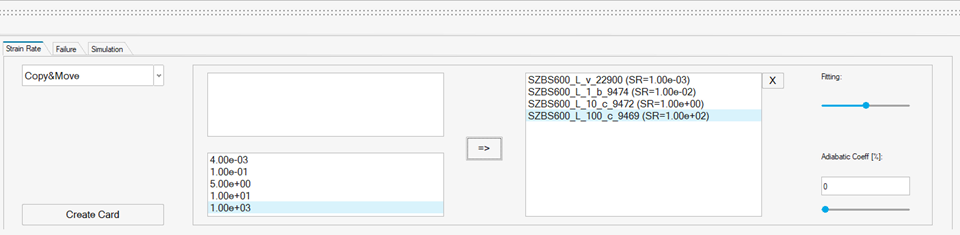
Figure 2. Strain Rate Dependant Curves -
Select Equation in the list box, a new panel will
appear.
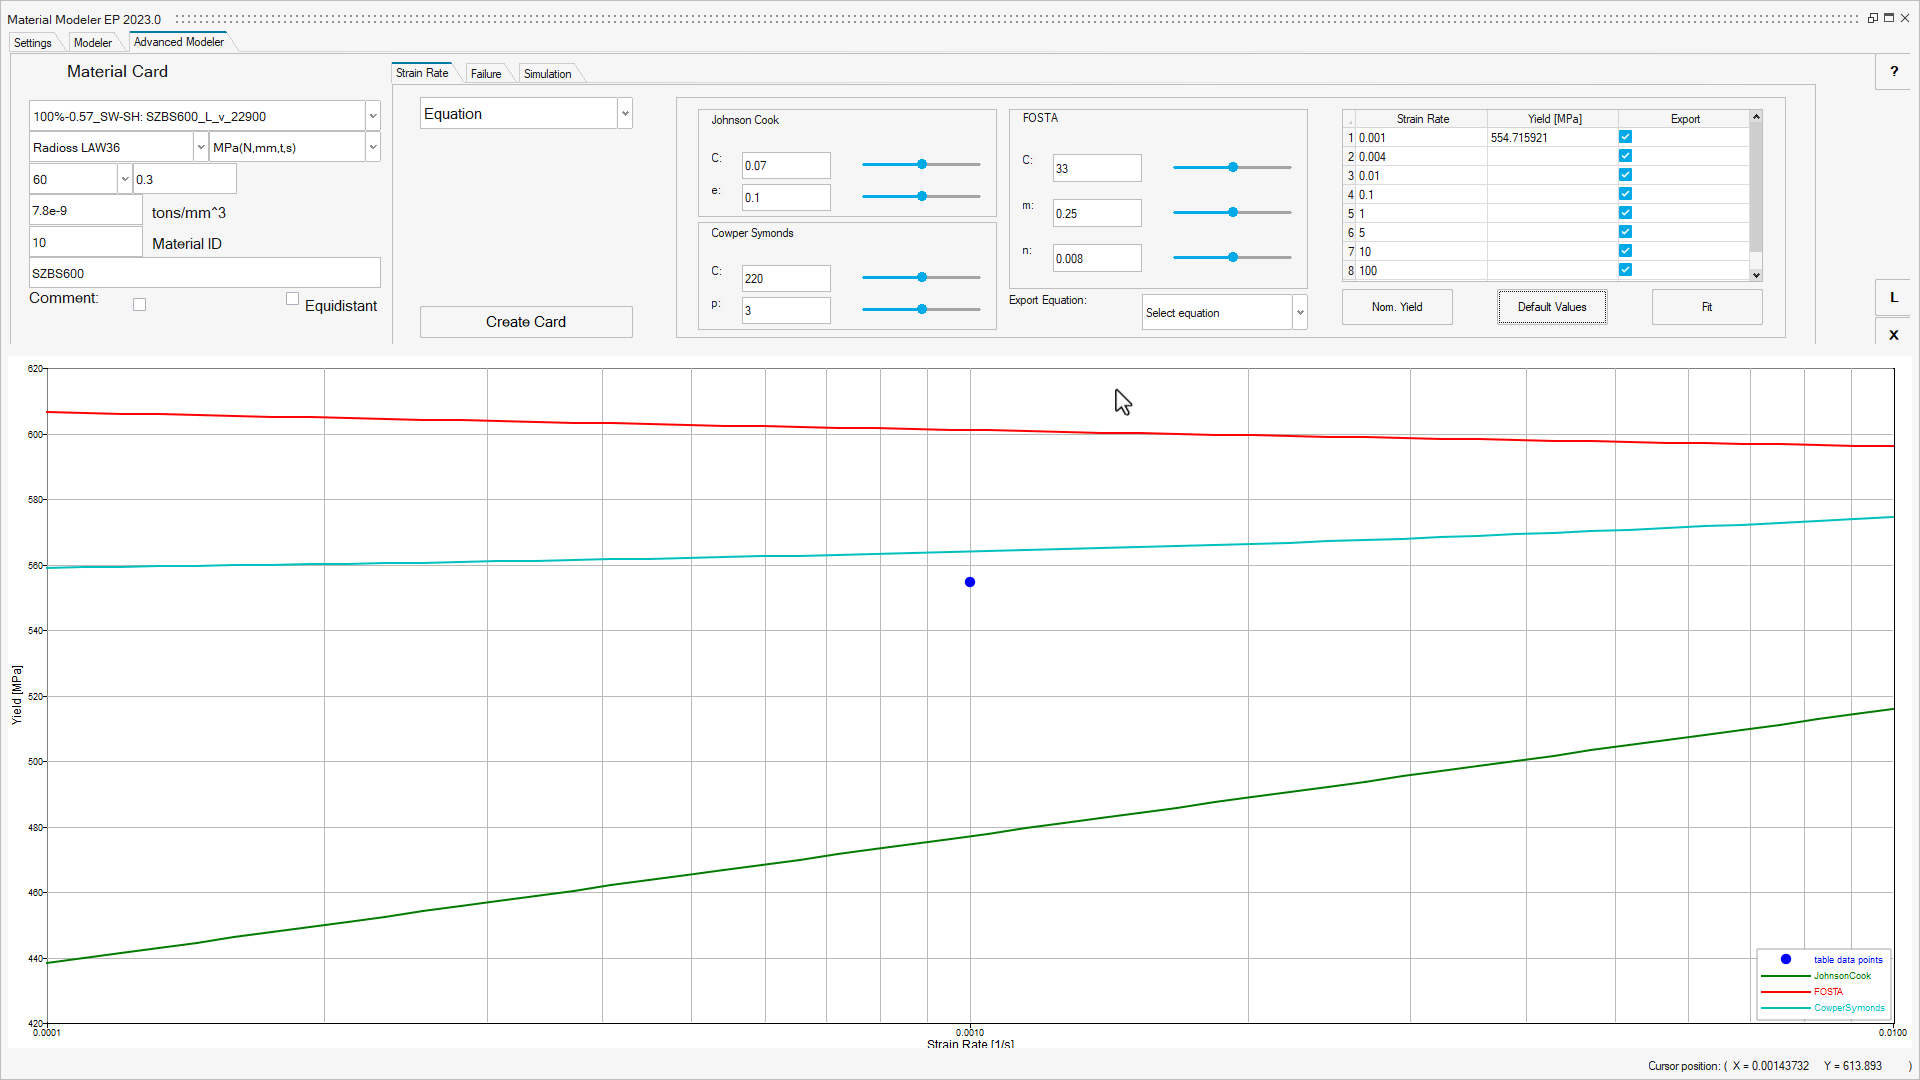
Figure 3. Strain Rate according to Equation Parameters -
Click Create Card to generate the Material Card.
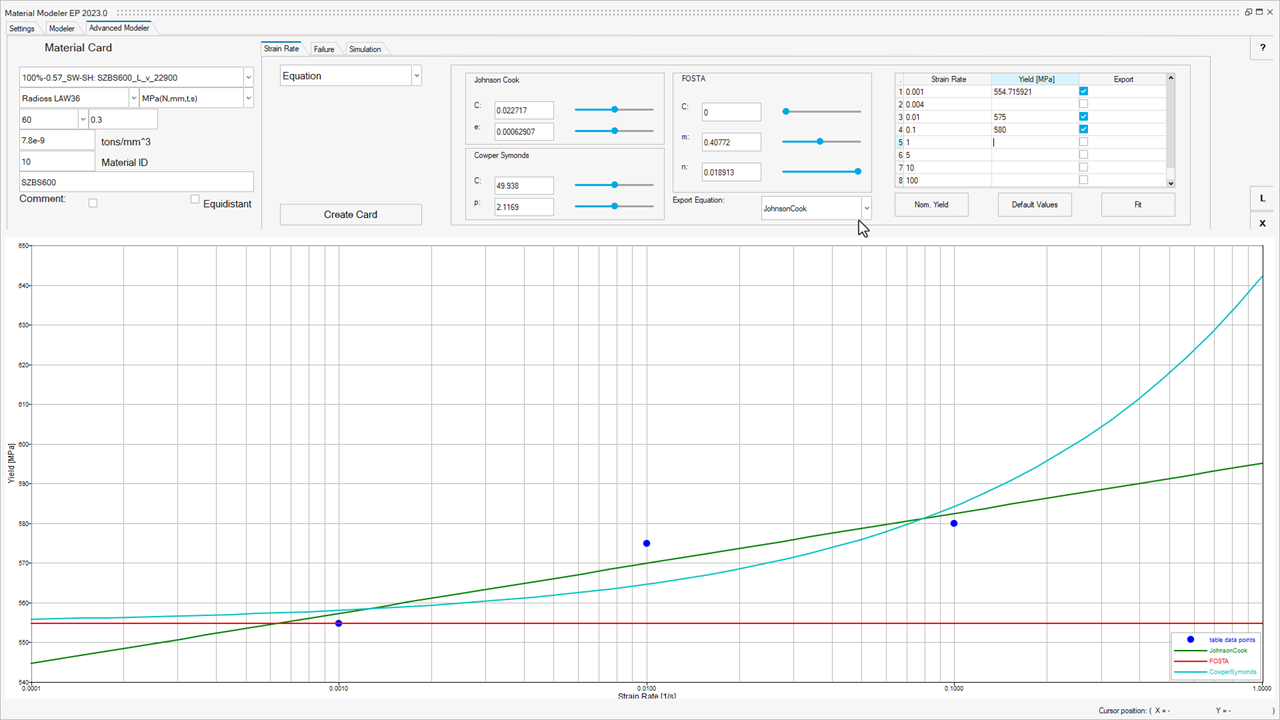
Figure 4. Strain Rate with Equation Fit for different yields