
Job Profiling
When job profiling is activated, Accelerator Plus tracks and plots performance statistics over the time the job is running.
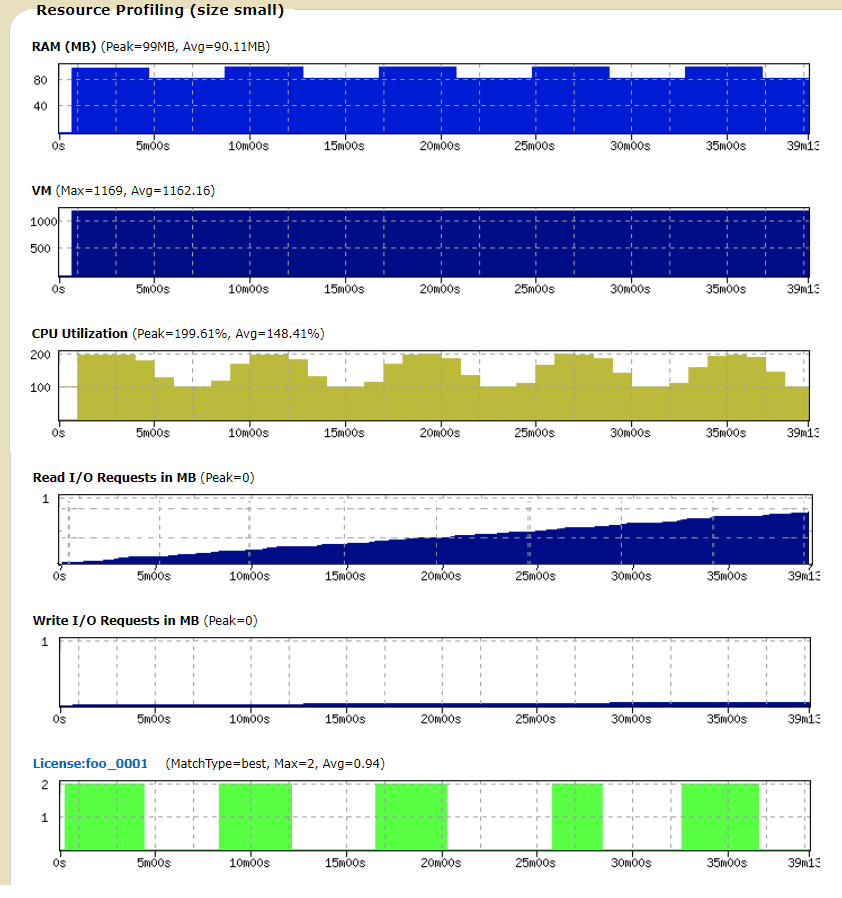
The profiling plots show, in order, the following performance data over time:
- RAM usage
- VM size
- CPU utilization
- Cumulative Read I/O
- Cumulative Write I/O
- License checkouts (one plot per license)
The output of job profiling is a set of plots as shown below: Figure 1.
To activate profiling on a single job, use the option -profile of
wx run as shown below:
% wx run -profile myJobTo view a profile, use the browser interface and visit the specific page for the job.
To activate job profiling for a jobclass, set the
following:
# In a job class definition
set VOV_JOB_DESC(profile) 1
To activate job profiling for all jobs, use the file
$VOVDIR/local/vncrun.config.tcl and add a line like this:
# In the file $VOVDIR/local/vncrun.config.tcl
...
set VOV_JOB_DESC(profile) 1
...