Zoom In
This option allow the user to reduce the visualization range of the chart to see less values. When this option is selected a sub-menu appears with three options to the zoom:
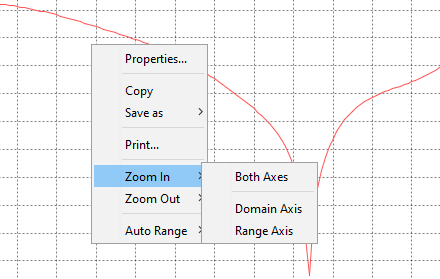
- Both Axes. Reduce the visualization range on the two coordinates of the chart.
- Domain Axis. Reduce the visualization range on the horizontal axis of the chart.
- Range Axis. Reduce the visualization range on the vertical axis of the chart.