Simulation and Analysis of the Rotating Drum Test
This section provides instructions for running a simulation of the rotating drum test and computing the Angle of Repose (AoR) and its temporal evolution using the provided files.
Introduction
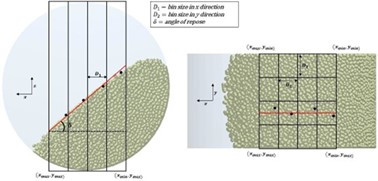
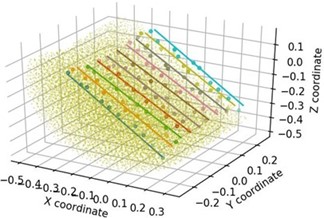
In order to determine the AoR of the particle bed, a point cloud is first constructed using particle sphere centers, particle centers of mass, or particle mesh nodes as appropriate. The bed free surface is then determined by subdividing a user-defined portion of the domain into a rectilinear grid of bins, identifying the highest particle (with a maximum global Z coordinate) in each bin and conducting a least-squares linear fit to the coordinates of these points as shown in Figure 1.
Prerequisites
All the requisite files are located at: <Altair installation folder>\EDEM <version>\examples\Calibration Kits\Rotating Drum.
Using the kit
| Parameter | Description |
|---|---|
| Temporal averaging: start time (s), end time (s), step factor (integer) | Specifies the start time (in seconds), end time (in seconds), and the Step Factor that determines the frequency of saved Time Steps to be included in the calculation (as an integer). The values should be comma delimited. The nearest saved Time Steps are used for the start and end of the analysis. |
| Domain limits: x_min,x_max,y_min,y_max (m) | Specifies the global X and Y bounds of the domain used for the analysis (in meters). The values should be comma delimited. Alternatively, you can specify ‘auto’ as a string, in which case the middle half of the surface along its length and width is automatically estimated over the specified time range and used for the analysis. |
| Bin size in x (m), bin size in y (m) | Specifies the length of individual bins in the grid in the X and Y directions (in meters). The values should be comma delimited. Alternatively, you can specify ‘auto’ as a string, in which case the bin length is estimated from the average neighbour distance in the point cloud. |
| Create results report (yes/no)? | Specifies whether individual results reports are written out
for every simulation deck and stored in its folder in
.csv format. |
| Summary report? (yes/no) | Specifies whether a summary report with the key results for
all simulation decks will be produced. The results are written
out in the Summary.csv file in the Python
script folder. |
| Plot figures? (yes/no) | Specifies whether a plot of the particle bed and surface fits
for the last saved time step included in the analysis is created
per simulation deck and stored its folder in
.png format. |
A settings text file is required for each folder containing EDEM simulation decks, and the settings are used to post-process all simulation decks in that folder.
The provided Python script can be executed from , or from the command line. To run the script from the command line, you must ensure that EDEMpy is installed in the relevant Python distribution. For more information about installing EDEMpy, see Install EDEMpy.