Browsers provide a structured view of model data, which you can use to review, modify, create, and manage
the contents of a model. In addition to visualization, browsers offer features like search, filtering, and sorting,
which enhance your ability to navigate and interact with the model data.
FE geometry is topology on top of mesh, meaning CAD and mesh exist as a single entity. The purpose of FE geometry
is to add vertices, edges, surfaces, and solids on FE models which have no CAD geometry.
Tools and workflows that are dedicated to rapidly creating new parts for specific use cases, or amending existing
parts. The current capabilities are focused on stiffening parts.
Use PhysicsAI to build fast predictive models from CAE data. PhysicsAI can be trained on data with any physics or
remeshing and without design variables.
The vehicle library models most four-wheeled vehicles in production today. Models can be modified interactively in MotionView to support topologies that are not supported in the vehicle library. The vehicle library is open-source, ASCII-based, and can be modified by you. The methods in the vehicle library can also be used and adapted to model non-automotive land vehicles, such as tractors and trucks.
A widely used process in the automotive industry is to split the suspension design and development into three distinct
stages. The stages are typically performed by different teams working in different locations and at different times during
the vehicle program. Ideally, the teams will share model data, modeling methods, and results widely. Since the teams are
working on the same vehicle, the engineering lessons learned by one group will need to be shared with the other two
teams.
The rear suspension model is built using the same process as the front suspension. Eleven different rear suspensions are
available using the Assembly Wizard.
A Braking in a Turn event simulates a vehicle decelerating in a circular path. The purpose of this event is to measure the stability of a vehicle
while braking and turning. The vehicle is driven straight for the entry length and then turns onto the circular path.
At the time to apply brakes, the brake torque is ramped on using the brake step duration time so the vehicle slows at
the desired deceleration rate. The event ends at the end of simulation time.
The Constant Radius event simulates a vehicle driving in a circular path. The Constant Radius event maintains a constant turn radius and varies the vehicle velocity to produce increasing amounts of lateral acceleration.
Steering and torque controllers maintain the path and the speed of the vehicle through the event. A plot template is available
to plot the results. The Constant Radius event is used to characterize the roll and understeer characteristics of a vehicle.
A Double Lane Change event drives the vehicle through a lane change and a return to lane maneuver, attempting to follow the centerline of the defined
lane. You can define the speed of the lane change, along with the lane dimensions. A steer controller is used to follow
the path and a drive torque controller is used to maintain speed throughout the event. The event supports right and left
lane changes. A plot template is available to plot the results.
A J-turn event simulates a vehicle response to a large steer in one direction, a dwell time to allow the vehicle to react, and a large
steer in the opposite direction, with an additional reaction time. The event is used to characterize the stability of
vehicles. Both steer directions can be run by reversing the sign of the steering inputs. A drive torque controller is
used to maintain a constant speed and standard outputs for the vehicle and tires are included in the tire system and the
output requests system. A plot template is available to plot the results.
The Kinematics and Compliance (K&C) test is performed by applying a range of forces at the two contact patches of a half-vehicle
model to determine the suspension’s characteristics. The motion of the wheel caused by the force application is measured
and recorded during this event. This in turn helps to determine suspension hard point locations, spring rates, bushing
rates, arm lengths, and so on.
A Power-off in a Straight Line event simulates the dynamics of a vehicle due to a sudden removal of drive torque. A steer controller drives the vehicle on
a straight line and the drive torque controller maintains speed until the throttle is removed. Engine motoring torque
is not applied after the throttle torque is removed. A plot template is available to plot the results.
A Pulse steer event simulates a vehicle response to a sudden pulse input to the steering wheel while driving in a
straight line at a constant speed. The input to the event can be a steering wheel torque or angle, and you can set
the pulse magnitude and width. The pulse can be input as a sine, step, or ramp function and you control the width.
A drive torque controller is used to maintain a constant speed, and standard outputs for the vehicle and tires
are included in the tire System and the output requests system. A plot template is available to plot the results.
The Single Lane Change event drives the vehicle through a single lane change, attempting to follow the centerline of the defined lane. You can
define the speed of the lane change, along with the lane dimensions. A steering controller is used to follow the
path and a torque controller is used to maintain speed through the event. The event supports right and left lane changes.
A plot template is available to plot the results.
A Sinusoidal steering event simulates a vehicle driving at a constant speed while a sin wave input is applied to the
steering wheel. The event is used to simulate the On-center steering test described in SAE paper 840069. Standard
vehicle outputs are included in the event. Body state variable output requests (displacement, velocity, acceleration)
are included in the body system and tire output is included in the tire system. A plot template is available
to plot the results.
The Static Ride analysis is a simulation of both wheels moving up and down, in phase, with the steering wheel held
fixed. The chassis is fixed-to-ground. The displacement of the wheel center is prescribed by the user. The suspension
moves via a simple control system and a “suspension test rig”. The wheel is constrained at the tire patch location
to the suspension test rig using an in-plane joint. Standard suspension requests (caster, camber, toe, etc.)
are included as part of the ride analysis and are described here. The front and rear suspension ride analyses are
similar.
A Sinusoidal steering event simulates a vehicle driving at a constant speed while a sin wave input is applied to the
steering wheel. The event is used to simulate the On-center steering test described in SAE paper 840069. Standard
vehicle outputs are included in the event. Body state variable output requests (displacement, velocity, acceleration)
are included in the body system and tire output is included in the tire system. A plot template is available
to plot the results.
A Step Steer event simulates vehicle response to a sudden step input to the steering wheel. The steering input is a rotational motion
or torque at the steering wheel or the input shaft to the steering gear. The standard output requests are
included to measure vehicle response. Tire requests are included to understand tire forces during the event. A drive
torque controller is added to maintain constant speed during the event to drive the vehicle forward. A plot template
is available to plot the results.
A Straight Line Acceleration event simulates a vehicle accelerating at a constant rate in a straight line. The event is designed to characterize the
chassis behavior during acceleration. A drive torque controller applies a controlled torque to the vehicle
drivetrain to maintain the requested acceleration. Output requests are included to measure the vehicle behavior, tire
response and other common vehicle system metrics. A plot template is available to plot the results.
A Straight Line Braking event simulates a vehicle slowing in a straight line. The steering wheel is normally held fixed but can be released. A
braking torque controller applies torque at the wheels to slow the vehicle and appropriate output requests
are included. A plot template is available to the plot the results.
A Swept Sine event simulates a vehicle driving at a constant speed with a sinusoidal steering input of constant magnitude but increasing
frequency applied. Output Requests are included to measure the vehicle state variables, tire forces, and tire
state variables. A Drive torque controller is used maintain the constant velocity of the vehicle. A plot template
is available to plot the results.
A Swept Steer event simulates a ramped steer input into a vehicle driving at a steady speed. The event is typically used to predict the
steady state dynamic response of the vehicle. Input can be steering wheel angle or torque. Standard vehicle
output requests are included in the event. A drive torque controller is included to maintain constant speed. A plot
template is available to plot the results.
A Throttle-off Cornering event simulates the dynamics of a vehicle driving a constant radius turn at steady state and the reaction of the vehicle
due to a sudden removal of the drive torque while cornering. The event includes a short straight section to
allow the vehicle to come to steady state, the constant radius circle, throttle removal, and the subsequent vehicle
reaction. A left or right turn can be simulated. The appropriate vehicle and tire output requests are included. A
plot template is available to plot the results.
A Throttle-off Turn-in event simulates the dynamics of a vehicle driving a constant radius turn at steady state, the reaction of the vehicle due
to a sudden removal of drive torque during the cornering event, and the reaction of the vehicle to a slowly
applied ramp steer. The event includes a short straight section to allow the vehicle to come to steady state, the
constant radius circle, throttle removal, and the increasing ramp steer. The event is designed to simulate a highway
exit ramp maneuver with a decreasing radius turn on the exit ramp. Appropriate vehicle and tire output requests are
included. A plot template is available to plot the results.
In MotionView, models are assembled from libraries of pre-defined systems using the Assembly Wizard, located on the Assembly ribbon. The Assembly Wizard dialog guides you through the assembly process, ensuring that your selections are compatible.
The attachments specified during the assembly process (using the Assembly Wizard dialog) can be modified using the
Attachment Wizard, located on the Assembly ribbon. The Attachment Wizard dialog guides you through the process of modifying the model attachments.
Explore, organize and manage your personal data, collaborate in teams, and connect to other data sources, such as
corporate PLM systems to access CAD data or publish simulation data.
The vehicle library models most four-wheeled vehicles in production today. Models can be modified interactively in MotionView to support topologies that are not supported in the vehicle library. The vehicle library is open-source, ASCII-based, and can be modified by you. The methods in the vehicle library can also be used and adapted to model non-automotive land vehicles, such as tractors and trucks.
Nine standard events can be added to a half-car model using the Task Wizard.
User-defined events for special tasks are also permitted and require the use and
understanding of both MDL and the MotionSolve XML input
deck. The following steps outline how to add a ride event.
From the Analysis menu, select Task Wizard to begin
adding an event to the model.
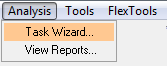
Figure 1.
Select Static Ride Analysis for this model.
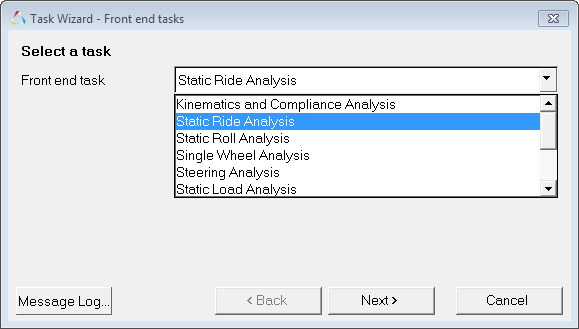
Figure 2.
Note: Nine different events can be added for a front suspension model.
Select Finish to complete the Task Wizard.
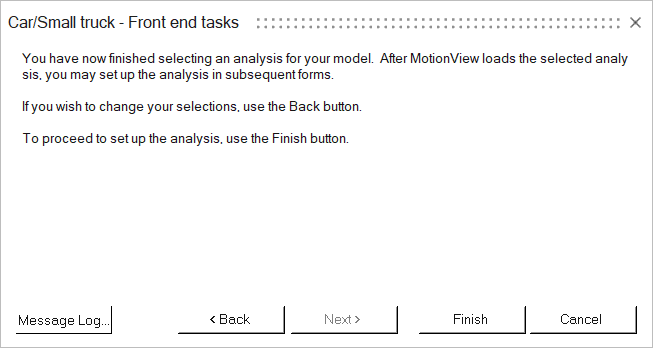
Figure 3.
Add the requested information for the vehicle. This information is used to
calculate the Suspension Design Factors and can be modified later.
Note that a mechanism is now added to the model to create the ride travel in
the suspension.
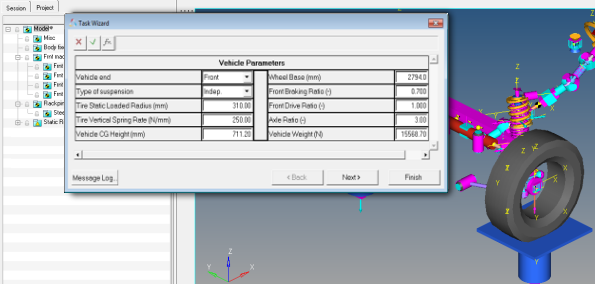
Figure 4.
Add the distance that the suspension will travel during the event in jounce and
rebound. The steering wheel is held fixed in this event.
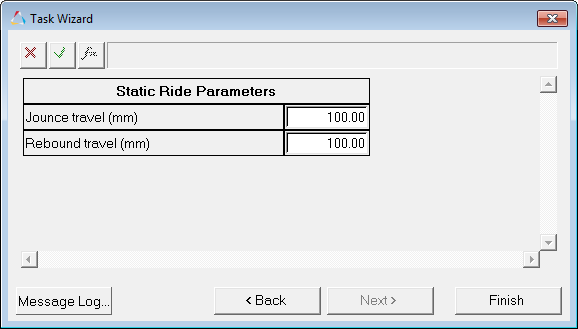
Figure 5.
The Static Ride Analysis event appears in the browser as the final
System/Analysis.
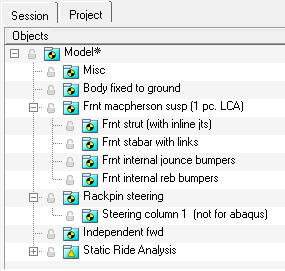
Figure 6.
The Static Ride Analysis event has a variety of MotionView modeling elements in it to create the ride
event.
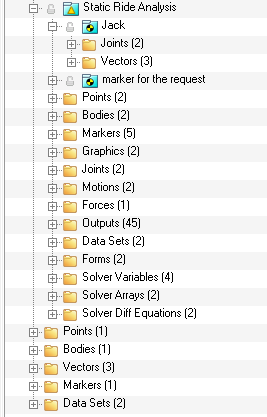
Figure 7.
Suspension Design Factors are created by the event. These
factors are used to evaluate the performance of the suspension. They are
automatically created to match the topology of the suspension being
analyzed.
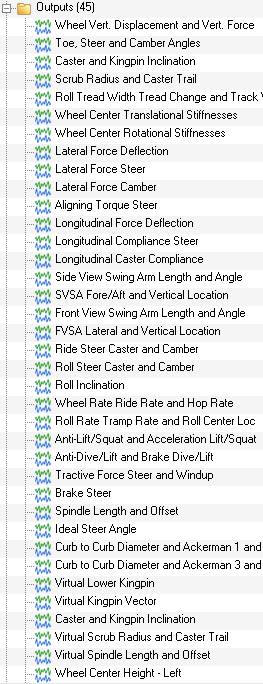